There is a great deal of euro-bashing circulating these days. The central argument is that Europe has been lagging the US economically, with an equally bleak outlook for the future. However, one often-overlooked factor is the significant role of massive borrowing—expansionary fiscal policy—in driving stronger US growth. When this is accounted for, the US’s apparent economic outperformance becomes less impressive.
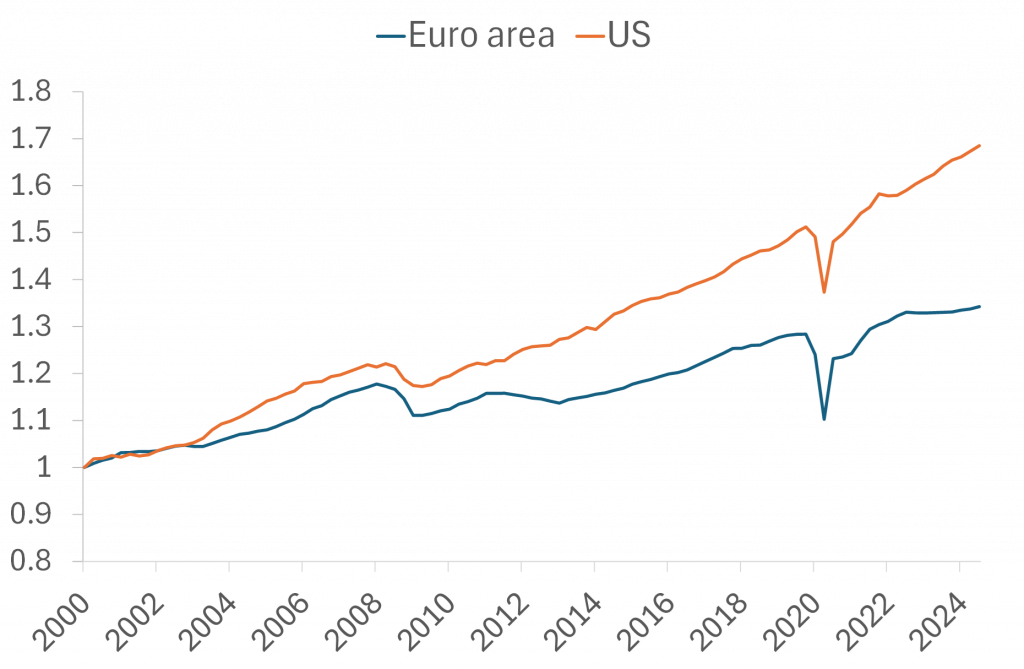
A sense of gloom hangs over Europe these days. Many people carry around graphs like the one I present in Figure 1. It shows real economic activity (GDP) in the US and the euro area since the start of the millennium.

Figure 1. Real GDP in the euro area and the US, normalized to “1” in 2000. Quarterly data, 2000:1-2024:2. Source: St. Louis Fed and J. Rangvid.
Europe and the United States experienced roughly similar economic growth before the global financial crisis in 2008, but the US has grown significantly faster since then. Since 2000, the US economy has increased by approximately 70%, compared to just 35% in Europe. Over the past few years, Europe’s growth has stagnated entirely.
This growing gap is concerning from a European point of view. Slower economic growth means slower income growth, leaving Europe with relatively less money to invest in education, healthcare, defence, consumption, etc. Numerous reports—most notably the Draghi Report (link)—have detailed the challenges facing Europe (“US innovate, Europe regulate”) and proposed strategies to address them.
One critical issue, however, often goes underexplored in these discussions: the United States has relied far more heavily on borrowing than Europe.
Borrowing and spending boost economic activity while the party lasts. However, if unchecked, excessive debt eventually risks undermining economic stability, leading to slower growth in the long term. I.e., debt-fuelled growth is not sustainable economic growth.
Debt accumulation in Europe and the US
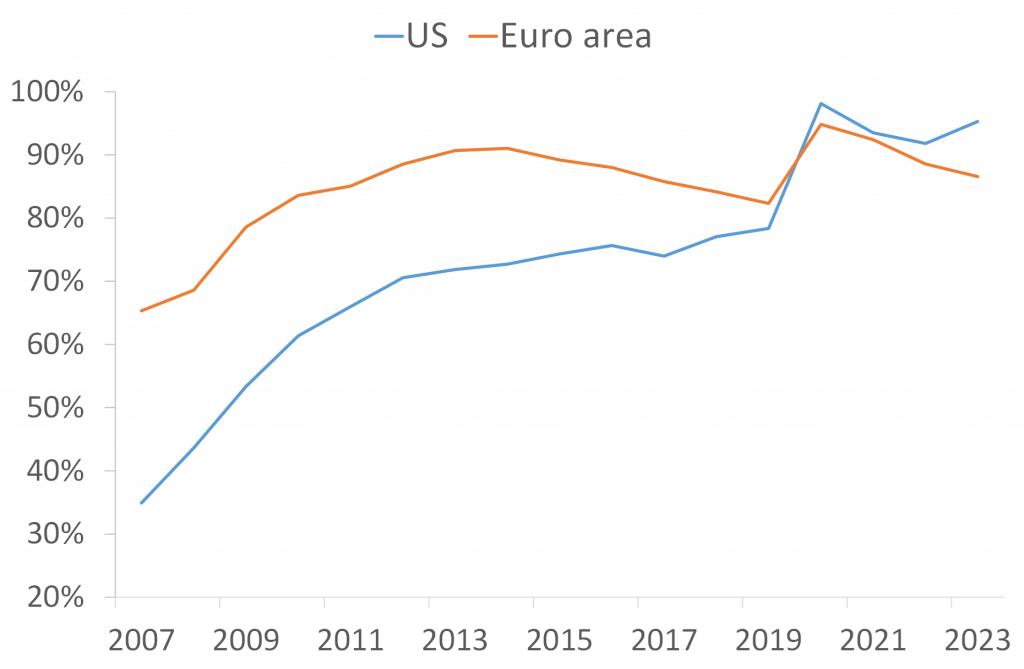
Figure 2 illustrates public debt as a percentage of GDP in the United States and the euro area since 2007, i.e., just prior to the global financial crisis.
Before the financial crisis, federal debt in the US amounted to just 35% of US GDP, whereas in the euro area it was nearly double that, at 65% of GDP.
Over the past 15 years, this picture has shifted dramatically. Today, the US is more heavily indebted than the euro area. By 2023, US federal debt had risen to 95% of GDP, compared to 86% in the euro area.

Figure 2. Euro area government gross debt relative to euro area GDP and US federal debt held by the public relative to US GDP. Annual data, 2007-2023. Source: ECB Data Portal, FRED St. Louis, and J. Rangvid.
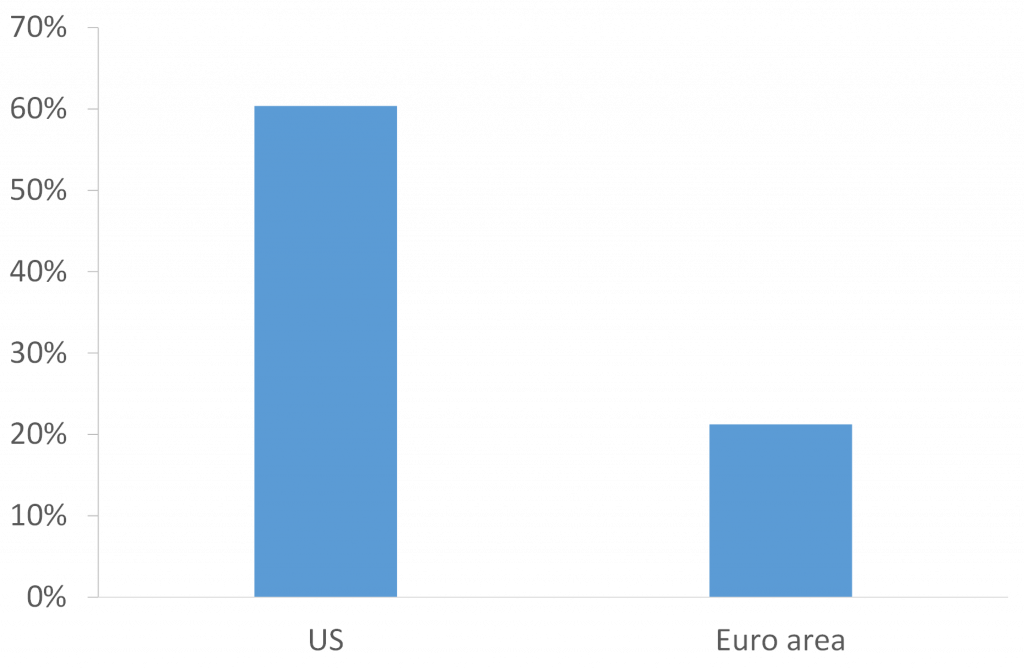
This surge in debt was driven primarily by responses to the 2008 financial crisis and the Covid-19 pandemic, with each crisis prompting the US to accumulate more debt (relative to GDP) than Europe. Since 2007, debt as a share of GDP has risen by 21 percentage points in the euro area but has soared by 60 percentage points in the US, as shown in Figure 3.
This extensive borrowing and spending have boosted economic activity in the US, helping to explain the divergent growth trajectories of Europe and the US since the financial crisis.

Figure 3. Percentage point changes in euro area government gross debt relative to euro area GDP and US federal debt held by the public relative to US GDP from 2007 to 2023. Source: ECB Data Portal, FRED St. Louis, and J. Rangvid.
How much have debt developments boosted GDP?
If the debt ratio in the US had risen as much (or, rather, as little) as it did in the euro area from 2007 to 2023—by 21 percentage points (as mentioned, euro area debt increased from 65% of GDP to 86%)—US debt as a fraction of US GDP would now stand at 56%, compared to its actual current value of 95%.
To put this into perspective, at the end of 2023, US real GDP was approximately USD 23 trillion. Ninety-five per cent of this equates to USD 22 trillion, while 56% corresponds to USD 13 trillion. This means that (real) US debt has increased by USD 9 trillion more than it would have if the US debt ratio had mirrored the euro area’s trajectory. How much GDP has been generated by this relatively larger fiscal expansion?
The fiscal multiplier measures “the change in a nation’s economic output generated by each dollar of the budgetary cost of a change in fiscal policy” (link). According to the hyperlinked paper from the Congressional Budget Office (CBO), estimates of the US fiscal multiplier vary significantly depending on the type of government spending, see Table 1.

Table 1. Size of US fiscal multiplier. Source: Reprinted from CBO (link).
For example, every dollar spent on goods and services is estimated to increase GDP by between USD 0.50 and USD 2.50. Despite the range of estimates, one consistent finding from the CBO’s data is that the fiscal multiplier is always positive.
For the sake of illustration, let us adopt a conservative estimate of 0.3 for the fiscal multiplier. An expansion of the US budget by USD 9 trillion between 2007 and 2023, implies—with a 0.3 fiscal multiplier—an expansion of economic activity by 0.3 × 9 = USD 2.7 trillion. This is an estimate of the debt-fuelled expansion of US GDP from 2007 to 2023.
This calculation also implies that if the US had expanded its debt ratio by the same factor as the euro area—from 35 per cent of GDP to 56 per cent of GDP, instead of 95 per cent of GDP—US GDP would have been USD 2.7 trillion smaller in 2023. Instead of being USD 23 trillion in 2023, US GDP would have been USD 20.3 trillion. Taking this into account, significantly alters the narrative of US economic growth.
From 2007 to 2023, the US economy has grown by 38 percent, while the euro area economy has grown by 15.5 percent, cf. Figure 1.
However, if US GDP had been 20.3 trillion in 2023, because the government would have increased its spending only as much as the euro area, the US economy would have grown by 20.5 per cent only since 2007. This is 5 percentage points more than the euro area economy has grown, substantially less than the 22.5 percentage point difference observed (38 per cent minus 15.5 per cent). Thus, a substantial portion of the growth disparity between the US and Europe can be attributed to the US’s more expansionary fiscal policy, i.e., debt-fuelled growth.
Importance of fiscal multiplier
The conclusions derived from these calculations depend on the assumed fiscal multiplier. A lower multiplier than 0.3 would highlight Europe’s growth challenge, suggesting that a smaller portion of US economic growth has been driven by debt. Conversely, a higher fiscal multiplier would make Europe’s growth issues appear less pronounced.
Figure 4 illustrates the growth gap between the US and the euro area from 2007 to 2023, adjusted for US debt-fuelled growth. The figure shows this gap for different values of the fiscal multiplier, ranging from a fiscal multiplier of 0 to a fiscal multiplier of 1. In other words, it shows the growth differential after accounting for the portion of US growth driven by a more expansionary US fiscal policy, i.e., what would the growth gap had been if the US debt ratio had increased as much (or, as little) as the euro area debt ratio.

Figure 4. Percentage-point difference between US and euro area accumulated economic growth from 2007 to 2023, adjusted for US debt-fuelled growth. Various fiscal multiplier assumptions.
If public expenditure is assumed to have no impact on economic activity (i.e., a fiscal multiplier of 0), the 22.5-percentage-point growth difference between the US and the euro area from 2007 to 2023 is entirely explained by factors other than the US’s larger debt accumulation. Europe would have a serious growth problem.
In contrast, assuming a fiscal multiplier of 0.4 indicates that nearly all the growth difference between the US and the euro area from 2007 to 2023 is attributable to debt-fuelled growth in the US.
Finally, with a fiscal multiplier of 1—where each additional dollar of government spending contributes an equivalent dollar to GDP—reveals that the euro area would have grown significantly faster than the US, by 30 percentage points over the 2007 to 2023 period, had it not been for the debt-fuelled growth in the US. Put differently, assuming a fiscal multiplier of 1, if the US had accumulated the same level of debt (relative to GDP) as the euro area from 2007 to 2023, rather than significantly more, US economic activity would have lagged euro area growth by 30 percentage points.
You might find it unsettling that the Europe vs US growth debate hinges on a single figure, like the fiscal multiplier. I feel the same. However, the core message is this: it is unrealistic to assume that all public spending has no economic value. Once we account for a modest positive economic impact from budget expansions, the apparent dominance of US growth becomes less striking. Personally, I find a fiscal multiplier around 0.3 to be a conservative assumption (given the numbers in Table 1), which suggests a modest—but not substantial—growth advantage for the US economy since the financial crisis.
Conclusion
There are many areas where the US economically outperforms Europe. The US grows faster, its stock market outpaces Europe’s, it produces more successful companies, and it leads in innovation. Like many others, I am concerned about Europe’s excessive regulation that dampens economic growth, and I fear it will persist unless Europe changes course.
However, not everything is better in the US. A key factor behind its faster growth since the financial crisis is its heavy reliance on borrowing. Factoring in this larger debt-financed fiscal expansion, a considerable fraction of the outperformance of US growth is due to US debt accumulation, i.e., has been debt-fuelled growth.
Debt-fuelled growth is not sustainable. So, stay tuned for my next blog post that will compare projected debt-growth dynamics in Europe and the US.


