


The Council for Return Expectations published its forecasts of expected returns last week. There is a wide dispersion across asset classes. Returns on “safe” assets (government bonds) are expected to be very low, even negative, on the short horizon, whereas emerging markets equities are expected to return close to ten percent per year. The Council also publishes forecasts for standard deviations, correlations, and inflation.
As one of my external activities, I chair the Council for Return Expectations (link). The Council estimates expected returns, standard deviations, and correlations on ten broad asset classes. The estimates are widely used in the Danish financial sector and public discussions. Danish pension funds use the estimates when they calculate pension projections for their customers and banks use them when they make projections for how outside-pension savings can be expected to develop. Newspapers also write about them, too.
I will argue that the Danish financial sector has been a front-runner in designing a way to make such independent return assumptions. I hope the set-up helps improving the credibility of the projections banks and pension funds make.
In this blog post, I present the latest estimates from the Council. As it is the first time I present these estimates on this blog, I start out describing why the Council was established, how the Council works, and the procedure we use in the Council to find expected returns. Afterwards, I present the forecasts.
Background: The Council for Return Expectations
The Council was established (under a slightly different name) two years ago. The background was as follows.
Danes have large pension savings. Together with the Netherlands, Denmark has the largest pension savings in the world relative to GDP (We have a paper describing some of the key features of the Danish pension system here; link). Historically, pension savings have been guaranteed, meaning that pension holders were guaranteed a minimum average annual return on their pension savings. Because of low interest rates, longer life-expectancies, etc., Danish pension funds have shifted into so-called market-based pension products during the last decade or so. In these products, there is no minimum guaranteed return. This allows the pension funds to invest more freely, hopefully enabling them to secure higher risk-adjusted returns. Basically, you go from a constrained to an unconstrained (or at least less constrained) maximization problem, which should lead to a better outcome. However, when a pension holder is not guaranteed a minimum return, the expected pension payouts during retirement will obviously become more uncertain. The assumed expected returns and risks on the different assets that pension funds invest in thus become even more important (compared to a guaranteed pension product) for an individual’s expected pension payments during retirement.
A couple of years ago, I was approached by the Danish pension industry and asked whether I would help them design a set-up that could be used to generate expected returns on pension funds’ investments. The result was the following: based on inputs from international financial institutions, present expected returns over the next ten years on ten different asset classes, as well as long-run (> 10 years) expectations on two assets classes (stocks and bonds), and update these forecasts annually. The pension industry judged that an independent committee should specify and regularly update the return expectations, in order to secure arms-length. They asked me if I would chair this committee. The Committee is now called the Council for Return Expectations
Last year, banks in Denmark asked whether we (The Council) would be able to expand the set of return assumptions. The background was – probably fair to say – a scandal in the largest bank in Denmark. Danske Bank had advised some of its customers to invest in an investment product that the bank itself expected would yield a lower return than a bank deposit. I.e., the bank had advised its customers to invest in a suboptimal product, given expected returns. It led to the resignation of the interim Danske Bank CEO (link). The Danish banking sector concluded that arms-length was needed in determining return expectations used for investments outside pension savings. They asked the Council if we could include return expectations for a shorter horizon (1-5 years, in addition to the 1-10 years horizon) and a more frequent update of the return assumptions (twice a year, instead of annually). These forecasts were published last week.
Procedure for determining expected returns
We provide forecasts for nominal returns on ten broad asset classes. Having done extensive research on the determinants of expected returns myself, I know that even within a precisely defined asset class, forecasters can disagree substantially on the outlook for the asset class. When designing the set-up, I thus suggested that return expectations should be based on an arms-length principle and take estimation uncertainty into account. We do this by basing our expectations on inputs from several international investment houses.
We (The Council) receive inputs from Blackrock, J.P. Morgan, Mercer, and State Street. We are truly thankful for their help.
Blackrock, J.P. Morgan, Mercer, and State Street provide their estimates of expected returns, standard deviations, and correlations on each of the ten asset classes for each of the different horizons to the Council. The ten asset classes for which we provide expected returns are:
- Government and Mortgage Bonds
- Investment-grade bonds
- High-yield bonds
- Emerging market sovereign bonds
- Global equity (developed markets)
- Emerging markets equity
- Private equity
- Infrastructure
- Real estate
- Hedge funds
The horizons are:
- 1-5 years.
- 6-10 years.
- 1-10 years.
Returns are nominal. Estimates are for the arithmetic average annual return per year during the different horizons.
Returns are hedged into euros, i.e. are euro returns, except from emerging market equities and local currency emerging market debt that are unhedged (emerging market debt is 50%/50% local/hard currency). The Danish kroner is pegged to the euro, i.e. euro returns are basically also Danish Kroner returns. Returns are before fees, expect from the last four asset classes (private equity, Infrastructure, real estate, and hedge funds) that are after fees to the funds that manage these types of investments, but before the fees to the Danish pension/mutual fund that in turn invests in the private equity funds, hedge funds, etc.
In addition, we provide forecasts for Danish inflation based on inputs from a number of Danish forecasters (the Danish central bank, ministry of finance, etc.).
The Council consists of three people: Torben M. Andersen (professor of economics, University of Aarhus; link), Peter Engberg Jensen (former CEO of Nykredit and current chairman of Financial Stabilitet; link ), and myself as Chairman. Our job in the Council is to specify the relevant asset classes and their characteristics, choose methods used to weight the inputs together, come up with reasonable forecasts, communicate these to the public, etc.
Forecasts of expected returns
The following table presents our forecasts of expected annual returns for the next five years, the next ten years, and years six through ten:
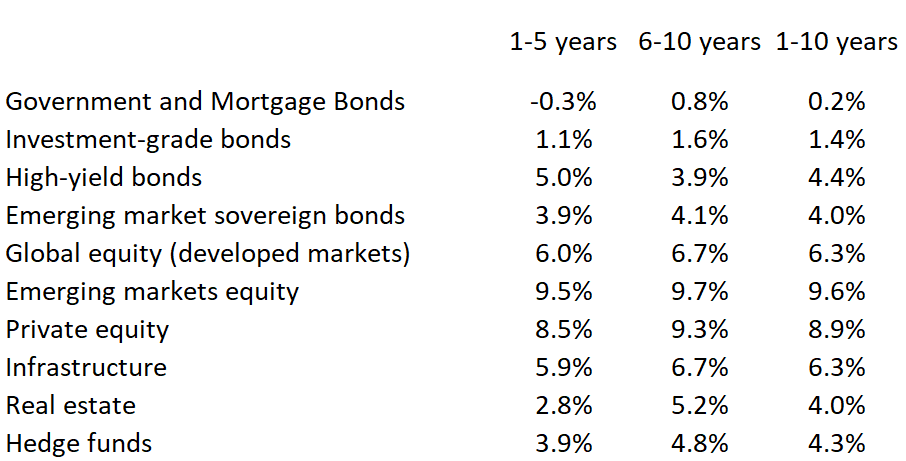
Over the next five years, we expect “safe” investments (government bonds and Danish mortgage bonds) to return a negative 0.3% per year on a pre-fees, pre-taxes, and pre-inflation basis. This is a low return. On a net-of-fees, after-tax, and real-terms basis, it is even lower. In the Danish media, much was written about this number (-0.3%). For finance professors and professionals, the number is no big surprise given low interest rates, but for ordinary investors, the publication of numbers such as these from trustworthy sources helps communicating the message that it is difficult to earn a decent return these days without taking on risk.
On a more technical term, the return on this asset class is the return to a bond portfolio consisting of 50% Danish mortgage bonds (that are triple-A rated, as you probably know), 20% Danish government bonds, and 30% Euro government bonds, with a duration of five years.
There is a wide dispersion across the different asset classes. For instance, we expect emerging market equity to yield 9.5% per year. There is thus an almost ten-percentage point difference between the expected return on the safest asset class and the asset class yielding the highest expected return.
Notice also that we generally expect higher returns after five years. We expect higher interest rates, causing capital losses and thus low returns during the first five years, but then higher returns later on. This in itself helps raising expected returns on other asset classes.
Standard deviations
In the Council, we want to stress that estimates of expected returns are surrounded by uncertainty. To the finance professionals, this is obvious (though, one might sometimes have the impression that even professionals tend to forget this), but to the ordinary investor, this is even more important to emphasize. The ordinary investor might otherwise conclude that when expected returns on emerging markets is 9.5% per annum, but government bonds are expected to yield a negative 0.3% per annum, I better put all my money in emerging market equity. We want to stress that this is a risky strategy. This ambition has guided us when it comes to our estimation of standard deviations.
The expected returns we present are constructed as simple unweighted averages of the expected returns of Blackrock, J.P. Morgan, Mercer, and State Street, asset-class by asset-class. They also provide us with their expected standard deviations. We do not use the simple averages of these as our estimates of expected returns, though. Instead, we regress the standard deviations we receive from the investment houses on the expected returns received from the same investment houses. The standard deviations the Council presents are then the fitted values from this regression. The main objective we achieve by following this procedure is that we make sure that there is a clear relation between risks and returns.
The standard deviations surrounding the estimates of expected returns are here:
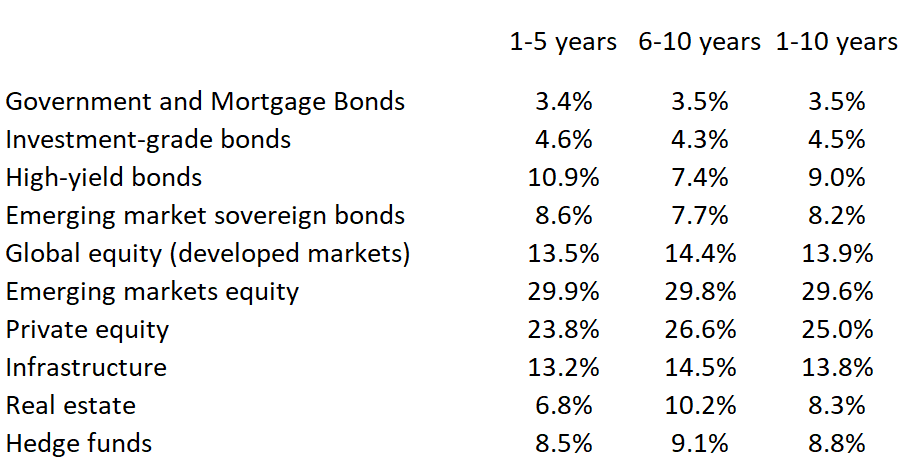
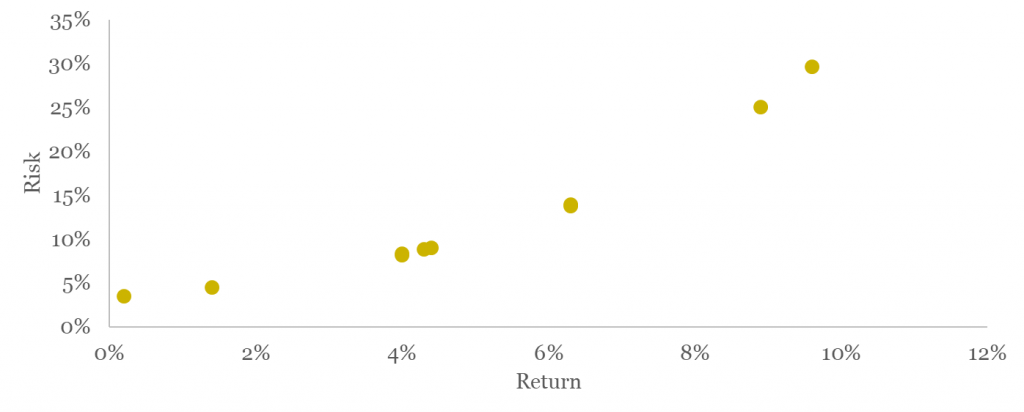
We expect a 3.5% standard deviation of government and mortgage bonds (over the next ten years) whereas we expect a 29.6% standard deviation surrounding the estimated returns to emerging markets equity. There is thus a clear relation between expected risks and returns. This clear relation also appears from this graph that plots risks on the ten asset classes against their returns (1-10 years horizon):
One might say that the price we pay from estimating standard deviations in this way is that some of the individual estimates of standard deviations might differ slightly from market consensus. As an example, our estimate of the standard deviation of global equity is around 14%. Market consensus probably is that this is a little higher, at 16%-17%. On the other hand, the advantage we obtain from proceeding in this way, as mentioned, is that we secure a clear relation between risk and returns.
Correlations
We also present correlations between expected returns. Here they are for the first ten years:
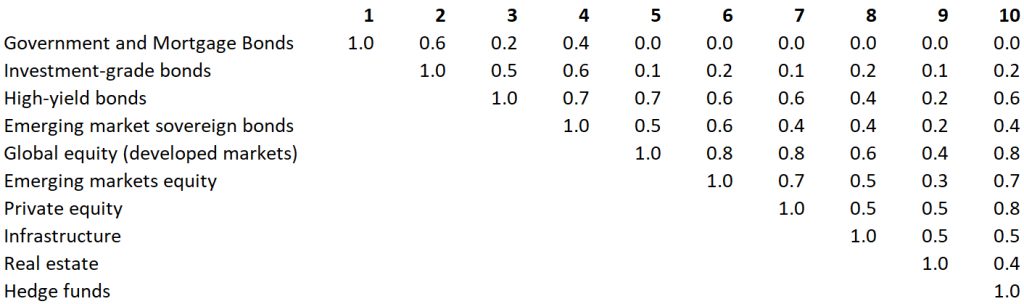
Correlations are simple averages of the correlations we receive from Blackrock, J.P. Morgan, Mercer, and State Street, asset-class by asset-class. The main thing to notice probably is that we expect all correlations to be positive. This is bad news for investors, one might argue, but we saw this during the March turmoil. In March, bonds and stocks both lost in value, i.e. bonds did not hedge the risk of stocks. Our correlations reflect this.
The correlations and standard deviations are used by the pension funds to calculate confidence intervals surrounding the individual’s expected pension income. I want to stress that it is advanced – and good! – that pension holders in Denmark not only learn about their expected pension income but also the uncertainty surrounding this expectation.
Inflation
We expect the Danish rate of inflation to be 1.2% over the next five years and 1.4% over the next ten years.
All the numbers
All the numbers – means, standard deviations, correlations, for all the horizons, etc. – are available on the webpage of the Council (link). On this webpage, addition information about the Council can be found as well.
Conclusions
We live in low-interest times. Investors might be tempted to invest more risky in order to generate a decent return. But what are decent returns? And how much extra risk do investors incur when investing more risky? In most countries, you get one set of answers when you visit one pension fund/bank/financial advisor, but another set of answers when you visit a different pension fund/bank/financial advisor. This makes investors uncertain and do not help building trust between the financial sector and investors. The financial sector in Denmark has found a cool way of presenting independent/arms-length forecasts. I hope that other countries might be inspired from this way of addressing this important issue.
—————————————————————————-
PS. In my last post (link), I wrote about a new paper I have written on the financial stability in the Nordics. The journal where the paper is published is now available (link). It contains my own article and articles on the banking union, bail-in debts, household debts, and macroprudential policy, as well as a number of enlightening discussions.