
The corona crisis is unique in many ways, not least with respect to the speed with which economies have started freefalling. Literally, from one day to the next, economies have been shut down, with grave consequences for economic activity.
Aggregate economic figures, such as GDP, consumption, etc., are collected and published with a lag. Normally, this is not a big problem, as changes in business cycles are typically not too abrupt. But this time, it has been a problem. In the early phase of the crisis, we had to rely on data from selected sectors that provided real-time insights. Restaurant bookings completely collapsed, footfall (number of people entering retail shops) fell, flight traffic dropped, etc. This was dramatic and foretold that economic activity more generally contracted significantly. But we did not know exactly how much.
We start getting the aggregate numbers now. They reveal with horrifying clarity that this recession is unprecedented.
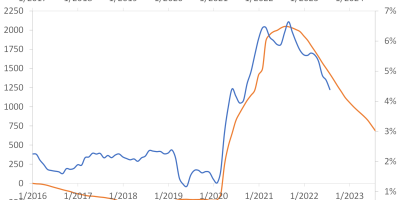
Initial claims for unemployment insurance in the US has been published weekly since 1967. The average from 1967 through March is 350,000, i.e. on average 350,000 people enter unemployment per week in the US, with a peak at 700,000 in October 1982 and another high of 665,000 during March 2009. In mid-March 2020, the number was a staggering 3,3 million, only to reach more than 6 million getting unemployed during the last couple of weeks, with the number last week being 525,000. In just four week, 22 million people have lost their job in the US. It is mind-blowing. And very sad.

Data source: St. Louis Fed Database.
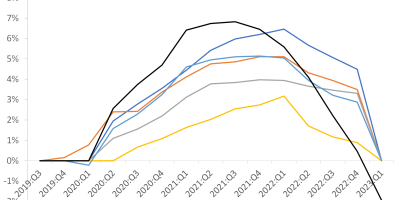
We have today received the latest GDP figures for China, for the first quarter of 2020. China has published quarterly GDP data since 1992. Annual growth has always been positive, even during the Great Recession of 2008-2009. In the first quarter of 2020, Chinese GDP was 6.8% lower than in the first quarter of 2019. An unprecedented fall.

Datasource: Thomson Reuters Datastream via Eikon.
We have also just received the latest figures for US industrial production. The drop in industrial production in March 2020 was the largest monthly drop since 1946. Industrial firms in the US cut production with 5.4% relative to February 2020. We also notice, though, that monthly drops in industrial production were larger during the Great Depression in the early 1930s and at the end of the second world war.

Datasource: St. Louis Fed Database.
These pictures tell a horrifying story about the freefall in economic activity. Expect more sad numbers to come. Hopefully, when economies start opening up again, we will see a rebound in economic activity. But the recession will leave lasting scars.