
Moving past the pandemic, we can now assess if it was more costly or not than anticipated. I find that the loss of economic activity was smaller than expected, which is good news. However, the number of deaths exceeded initial predictions, resulting in higher-than-expected costs in terms of premature loss of life. Considering both the economic and human costs, the total cost of the pandemic is largely consistent with my initial estimates. I present calculations for a large economy, the US, and a smaller one, Denmark. Interestingly, the assessments are qualitatively very similar, indicating that the findings are likely representative of other countries as well.
Using the method proposed by David Cutler and Lawrence Summers, who calculated the expected cost of the Covid-19 pandemic for the US in autumn 2020 (link, link), I presented several related calculations in winter 2020/2021. In December 2020, I presented the expected cost of the pandemic for Denmark (link). In January 2021, I updated the calculations to account for the severity of the second wave of the pandemic (link). Finally, in February 2021, I calculated the projected global cost (link).
Cutler and Summers (CS) and I calculate two types of costs: (i) the direct economic cost in terms of forgone economic activity and the (ii) health costs which are the economic values of premature deaths, health impairments, and mental health impairments.
The calculations for the US presented by CS, and for Denmark and the world presented by me, relied on predictions made in autumn 2020 for how economic activity and the pandemic would develop for the coming years.
Now, in early 2023, we leave the pandemic behind us. This means we can calculate the actual cost of the pandemic up to this point, update our expectations for the future, and compare our predictions from 2020 with what we know today.
In this analysis, I will focus on the costs for the US and Denmark. First, I will calculate the costs of the pandemic in terms of forgone economic activity, followed by a discussion of health costs.
Forgone economic activity in the US
The pandemic caused lockdowns, restrictions, disrupted supply chains, uncertainty, and much more, resulting in an unprecedented sharp fall in economic activity in March and April 2020. Then, the economy rebounded strongly, in fact too strongly. The economy overheated. As a result, we now have inflation and raising interest rates, meaning we face a period with low economic growth, potentially even a recession.
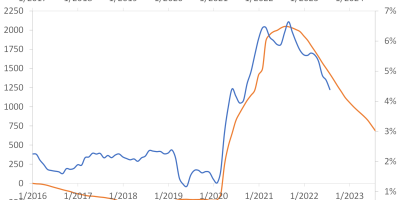
CS compared economic projections from the Congressional Budget Office (CBO) made in the beginning of the pandemic to projections made before the pandemic, i.e. predictions made in July 2020 (after the breakout of the pandemic) compared to predictions made in January 2020 (before the pandemic). I show these in Figure 1. In addition, I include in Figure 1 actual GDP growth during 2020-2022, and the latest projections from the CBO for 2023-2030.

Data source: Congressional Budget Office (CBO and the Fed St. Louis).
Before the pandemic, the CBO predicted that US real economic activity (US real GDP) would grow by around 2% per annum during 2020-2030. The pandemic changed this prediction in a dramatic way. When the CBO in July 2020 assessed the impact of the pandemic, they predicted that economic activity in the US would fall by 5.8% in 2020, only to rebound by 4% in 2021 and 3% in 2022. After this, growth was expected to be normalized at 2% per year.
Today, we know how the US economy fared during 2020-2022. Instead of an enormous contraction in 2020 (GDP was expected to fall by 6%, Figure 1 shows), GDP “only” fell by 2.8%. And, similarly, while the CBO in July 2020 expected the economy to rebound by 4% in 2021, the economy rebounded even stronger, growing by an amazing 6% in 2021. Finally, growth in 2022 turned out to slightly lower than predicted in July 2020, at 2.1% instead of the predicted 2.9%.
The essential message from this is that the US economy fared much better than feared. The recession in 2020 was considerably milder and the rebound in 2021 much stronger. This has huge consequences for the calculation of the cost of the pandemic.
CS calculate the expected economic cost of the pandemic as the difference between total economic activity (GDP) expected before and after the pandemic. This appears in Figure 2, together with the actual GDP development during 2020-2022 and the expected path from here, based on the latest CBO projections.

Data source: Congressional Budget Office (CBO).
The “Jan-2020” line shows how total economic activity in the US (GDP in real terms) in January 2020, i.e. before the pandemic, was expected to develop over the following decade, growing from $19,075bn in 2019 to $19,495bn in 2020, then to $19,874bn in 2021, and so on.
The pandemic implied that the CBO lowered its prediction for 2020 to $17,968bn, to $18,679bn for 2021, and to $19,222bn for 2022 (the “July 2020” line). Accumulated over those three years, this is an expected loss of economic activity of $3,703bn. This is the number CS reported (link, link). It is the accumulated difference between the blue and the orange lines in Figure 2. It corresponds to 19.4% of pre-pandemic 2019 GDP.
The economy fared much better than expected, with GDP reaching $18,509bn, $19,609bn, and $20,018bn in 2020, 2021, and 2022, respectively. As a result, the economic loss was much smaller than CS predicted, at $1,435bn, or 7.5% of 2019 GDP. In conclusion, the loss of economic activity during 2020-2022 turned out to be less than half of what CS had expected.
Beliefs about the future have been updated as well. The strong rebound in 2021 was due to very expansionary fiscal and monetary policies. Unfortunately, we now know that these policies were too expansionary. They caused an overheated economy, resulting in inflation like that seen in the 1980s and rapidly rising interest rates. Consequently, growth in 2023 will be very low and considerably lower than expected in July 2020 (0% vs. 2%, as shown in Figure 1). On the other hand, growth post-2025 will be higher than expected in July 2020.
The predicted fallout due to the pandemic for 2023-2030 is expected to be $581bn, which is much smaller compared to the fallout of $3,888bn that CS expected. Table 1 summarizes these calculations.

The total cost of the pandemic for the US from 2020 to 2030, considering the better performance during 2020-2022, the worse performance during 2023, and the marginally better performance during 2023-2030, has been reduced from the $7,591bn that CS expected to $2,016bn. This represents a loss of 10.6% instead of the 40% of pre-pandemic 2019 GDP that was initially predicted.
10.6% of GDP is a lot. It is USD 2 trillion. The pandemic was very expensive. However, and that is the good news, it was not nearly as expensive as feared.
Forgone economic activity in Denmark
Denmark is a small open country, implying that the Danish economy is heavily influenced by global developments. Therefore, the conclusions drawn above for the US largely apply to Denmark as well.
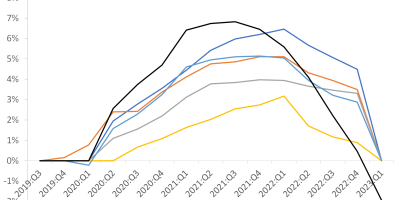
Figure 3 shows annual growth rates of Danish real GDP, including the expected scenario prior to the pandemic (“Expected scenario (2019)”), the scenario expected early in the pandemic (“Expected scenario (2020)”), realized growth for 2020-2022, and the updated expectations for economic growth for 2023-2025. Like CS relied on an external trustworthy source for the US economy (the CBO), I rely for Denmark on the expectations from the independent and esteemed Danish Economic Council. I use their predictions up until 2025. The numbers in columns “Predicted 2023-2025” are the latest forecasts from the Council.

Data source: Danish Economic Council (DEC).
Figure 3 largely tells the same story as Figure 1 told for the US. The figure shows that in 2019, before the pandemic, future economic growth was expected to be around 1.5% per year for the next several years. However, when the pandemic hit, forecasts for 2020 were dramatically reduced. In late 2020, when the first calculations were presented, it was expected that the recession would be severe, with GDP falling by 3.6% in 2020. It was also predicted that this would be followed by a strong rebound in 2021, with GDP growing by 3.8%.
We now have the actual data for 2020-2022. The 2020 recession was milder than expected. Real GDP fell by 2% in 2020 instead of the predicted 3.6% fall. Similarly, the rebound in 2021 was even stronger than expected (at 4.9% vs. the expected 3.8%). Growth in 2022 was also higher than expected (3.6% vs. 2.9%).
Figure 4 shows the expected and realized developments in GDP.

Data source: Danish Economic Council (DEC).
Rather than dropping to DKK 2,075 billion in 2020 from the 2019 level of DKK 2,150 billion, the actual GDP contraction was smaller, bringing GDP down to DKK 2,110 billion in 2020. Furthermore, the economy rebounded more strongly than expected, and by 2021 had already returned to trend growth, while in 2022 it exceeded the trend.
The loss of economic activity is calculated as the accumulated difference between the level of GDP expected before the pandemic and realized GDP. This loss has been considerably smaller than predicted early on in the pandemic. Table 2 shows the calculations of the costs for Denmark in terms of forgone GDP.

Instead of an expected cost of DKK 204bn for 2020-2022, equivalent to app. 10% of pre-pandemic 2019 GDP, the realized costs for 2020-2022 for Denmark ended at DKK 34bn, or slightly below 2% of GDP. This is very good news.
On the other hand, like the US, one of the main reasons why the costs for Denmark during 2020-2022 were lower than expected is that Denmark, being a small open economy, benefited from the unexpectedly strong rebound in global economic activity due to the super expansionary monetary and fiscal policies. Unfortunately, Denmark will also face low growth in 2023 as the economy struggles with high inflation and rising interest rates. Part of the reason inflation is high is the war in Ukraine, but the main reason, as I explain here (link, link), is the pandemic.
Figure 3 indicates that economic growth is projected to be very low in 2023 (0% instead of the previously predicted 3% in late 2020, where 3% of GDP corresponds to approximately DKK 60bn), which will further add to the economic costs of the pandemic.
In total, putting everything together, best guess right now is that the loss from the pandemic will amount to DKK 73bn, or 3.4% of 2019 GDP, Table 2 shows. This can be compared to the expected loss of DKK 210bn, as calculated in 2020.
Health costs and total costs for the US
Cutler & Summers estimate the economic value of health costs resulting from the pandemic based on the number of deaths. This includes the economic value of premature mortality, the economic value of health impairments, and the economic value of mental health impairments.
CS expected 625,000 deaths in the US because of the pandemic (450,000 Covid-19 deaths and 40% additional deaths from other causes related to the pandemic). CS assumed that the economic value of a lost life is 70% of the value of a statistical life, which is USD 10m, i.e. USD 7m per death. This led to the projection of an economic cost of USD 4.4 trillion due to premature mortality. This is 20% of 2019 US GDP.
Many more people died during the pandemic than expected. Instead of the projected 625,000 deaths, over 1.1 million Americans passed away. Using CS’s assumptions, the economic value of premature deaths turned out to be 1.1m x USD 7m = USD 7.7 trillion, exceeding the predicted USD 4.4 trillion. While CS overestimated the value of forgone economic activity, as shown in the previous section, they underestimated the value of premature deaths.
CS assumed that there would be seven times as many survivors from severe or critical Covid-19 diseases as Covid-19 deaths, and that a third of these would experience long-term health complications. CS assumed that the economic value of a long-term complication is 35% of the value of a premature death, i.e. 35% of USD 7m. Given CS’ expectations in 2020, this amounted to USD 2.6 trillion, or 12% of US GDP. Now, with 1.1 million deaths, the value of long-term health impairments amounts to USD 6.3 trillion, instead of the predicted 2.6 trillion.
CS also included an estimate of the economic value of mental health impairments. In this calculation, I disregard those for simplicity.
Table 3 collects the numbers for the US.
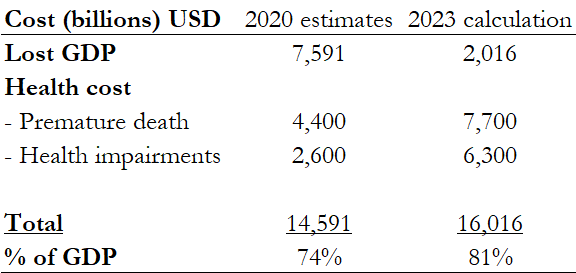
In total, leaving aside costs of mental health impairments, the cost of the pandemic amounts to USD 16 trillion, or 81% of pre-pandemic 2019 GDP. This is not far from CS’ original estimate in 2020 (74% of 2019 GDP).
So, the total cost ends up being reasonably close to what was predicted in 2020, but the composition of the cost is very different from what was expected. The economy fared better than expected, but more people died from Covid-19, generating higher health costs.
Health costs and total costs for Denmark
The story is similar for Denmark. In late 2020, using the same method as CS used for the US, it was expected that the pandemic would cause 2,900 deaths in Denmark. However, up until now, almost three times as many people, that is 8,200, have died. In Denmark, the value of a statistical life is DKK 34m, and using 70% of this, the total value of premature deaths is estimated to be DKK 195bn, which is higher than the DKK 71bn expected in 2020. Similarly to CS, the value of forgone economic activity was overestimated, but the value of premature deaths was underestimated.
If seven times as many survived a severe or critical Covid-19 disease, and a third of those experience long-term complications, the economic value of health impairments would be DKK 160bn, instead of the DKK 41bn I expected in 2020.
In total, for Denmark, this means the updated costs of the pandemic would be as in Table 4.

The total cost of the pandemic now corresponds to 20% of pre-pandemic GDP, not far from the estimate in 2020 (15%). But, like the US, the decomposition of the cost shows large deviations from expected. The economy fared better than feared during 2020-2022, but more people died from Covid-19, generating higher health costs.
Discussion
While the calculation of the value of forgone GDP is relatively standard when it comes to assessing the value of economic crises, the calculation of the economic value of health costs due to the pandemic is controversial. When my calculations were published, there were many reactions. Some appreciated the idea of considering the economic value of a lost life, while others disagreed, arguing that it’s inappropriate to assign an economic value to human life. I’ll leave it to the reader to decide. However, I agree that some of the specific assumptions made can be debated. Let me briefly comment on some of them here.
First, the value of a statistical life used in the calculations may seem high. Specifically, the assumption made by CS (which I follow) that the economic value of a premature death due to Covid-19 is 70% of a statistical life may be considered aggressive given that most people who passed away from Covid-19 were elderly. It is reasonable to discuss what the appropriate percentage should be: Perhaps 40% of the value of a statistical life, perhaps 60%, or perhaps something else. I will leave that debate to others.
Instead, I can report the numbers if one uses more conservative estimates of the value of a lost life. For instance, if 60% of a statistical life is considered, the cost of premature deaths in Denmark would be DKK 167bn (8% of 2019 GDP) instead of the DKK 195bn reported in Table 4. If 40% is used, the cost would be DKK 111bn (5% of GDP). Similarly, for the US, the cost would be USD 6,600bn if 60% is used, and USD 4,400bn if 40% is used. These can be compared to the USD 7,700bn mentioned in Table 3.
Second, and relatedly, it is now known that many people who died had Covid-19 but did not necessarily pass away because of it, especially during the later stages of the pandemic. Many patients were hospitalized with other illnesses and died due to those illnesses but happened to have Covid-19 at the time of death. As Our World in Data explains: “Due to varying protocols and challenges in the attribution of the cause of death, the number of confirmed deaths may not accurately represent the true number of deaths caused by COVID-19.” It is very difficult – if not to say impossible – to adjust the number of deaths to find the “true” number. The only thing we can say is that the number is probably on the high side.
Third, while the economic value of premature deaths seems high, the value of long-term health impairments probably seems more realistic; as mentioned, this is calculated as 35% of 70% of a statistical life, i.e. 25% of the value of a statistical life.
Fourth, the number of people facing health impairments is a “back-of-the-envelope” calculation. It is the number of deaths multiplied by 7 and then divided by 3. For Denmark, this gives 19,000 people. In the early phase of the pandemic, data on the number of people suffering from long-term health complications were not available, but now, at least for Denmark, they are. For instance, we know that 7,331 people have had contact with hospitals during the pandemic due to Covid-19-related post-acute symptoms (link). This is considerably lower than the 19,000 used in the calculations above, but at the same time, these are the most severe cases, i.e. cases requiring hospital treatment. There are also people who receive treatment from their local doctor or in local municipalities, which the registry does not include. Therefore, perhaps the number 19,000 is not too far off. An interesting finding here is that 75% of the hospitalized people did not have any prior disease, which may support the assumption that the cost of suffering from post-acute symptoms is relatively high. The number of hospitalized Americans with post-acute symptoms is unknown, but an article (link) reports that 26% of infected people had not fully recovered after 6-8 months, indicating that the total number of people with long-term health impairments is uncertain but probably high.
Conclusion
There are several central take-aways from this analysis:
- The economic loss from the pandemic was huge.
- The good news is, though, that the economic fallout ended up being considerably smaller than feared in the early phase of the pandemic. The recession in 2020 was milder and the bounce-back in 2021 stronger.
- The bad news is that more people passed away with Covid-19 than expected. We can discuss what the economic value of a human life is, but it is positive, meaning that the cost of premature deaths ended up larger than expected.
These conclusions hold for a large country (US) and a smaller one (Denmark), thus probably being representative for many countries.