
The US economy has proved remarkably resilient during this period of monetary tightening. One important reason is that households had large savings left over from the pandemic when the tightening began. I analyse why household savings accumulated during the pandemic and when they will be depleted. When this happens, households will be less resilient, which may have a negative impact on consumption and economic activity. I also analyse how excess savings are related to the flare-up and subsequent decline in inflation. The relationship is striking.
The US economy is very strong. The latest figures show that the US economy grew at an annualised rate of 4.9% in the third quarter of 2023 (link), more than twice the average growth rate of 2% in recent decades.
This was not to be expected. The US Federal Reserve has been aggressively raising interest rates to cool the economy. Obviously, this has not had the intended effect.
US consumption accounts for two-thirds of US economic activity (GDP). To understand why the economy has been so resilient, we thus need to understand the resilience of the US consumer. In my last analysis (link), I argued that economic activity has held up well because US households had excess savings left over from the pandemic. In this analysis, I go deeper. I want to understand why savings accumulated and when they will be depleted. This is important because at that point consumption will start to suffer from restrictive monetary policy, which most likely will have a negative impact on the US economy as a whole.
I examine the US consumer because the US economy is the largest in the world. So a strong US economy helps other economies weather tight monetary policy too. The conclusions from this analysis about when US households have used up their excess savings are therefore relevant not only for the US but also for other countries.
US household savings
When households spend less than they earn, they save. Figure 1 shows disposable personal income and personal outlays in the US since 2013. Personal outlays are personal consumption expenditure + interest payments + transfer payments. Consumption expenditure accounts for more than 96% of outlays. I show outlays in Figure 1 because personal savings – which is what this analysis is about – is defined as the difference between disposable income and outlays.

Source: FRED of St. Louis Fed and J. Rangvid.
Before the pandemic, disposable income and outlays were both rising evenly and steadily. Immediately before the pandemic, in January 2020, US households earned a total of just over $1,380 billion. They had outlays of about $1,280 billion. This means that US households saved $100 billion in January 2020, a savings rate of 100/1,380 = 7.2%.
Figure 1 shows that the pandemic had a very dramatic impact on the income and outlays of US households.
Household incomes were boosted by the huge pandemic aid packages that were implemented in April 2020, January 2021 and March 2021: The CARES act (link), the Consolidated Appropriations Act (link), and the American Rescue Plan Act of 2021 (link), respectively.
At the same time, consumption was dampened because consumers could not spend money on services as many service providers (restaurants, sports facilities, etc.) were closed during the pandemic lockdowns. As a result, spending fell sharply in April 2020 and remained subdued throughout 2020.
When incomes rise and spending is subdued, households save a lot of money. Figure 2 shows total personal savings before, during and after the pandemic.

Source: FRED of St. Louis Fed and J. Rangvid.
Before the pandemic, households were saving about $100 billion a month. At the start of the pandemic, savings exploded to nearly $500 billion in April 2020 and March 2021, and remained unusually high in 2020 and the first half of 2021. Between January 2016 and December 2019, i.e. before the pandemic, households saved on average about $80 billion per month. From March 2020 to December 2022, households saved almost three times as much, more than $200 billion per month.
Excess savings
So households accumulated a lot of savings during the pandemic, much more than they normally do, but how much more than they would have done if the pandemic had not occurred?
We can see how much households saved, but we cannot see the counterfactual. Therefore, to assess households’ pandemic-related “excess savings”, we must make assumptions about how much they would have saved in the hypothetical scenario that the pandemic had not occurred, and then compare this to what they actually saved.
Different researchers make different assumptions. This paper (link) uses a “Hamilton (2018) filter to extract a time-varying trend savings rate”, while this paper (link) takes a simpler approach: “Personal savings had a trend, which is calculated for the years 2016-2019”. I follow the latter but add additional robustness in terms of the period used to calculate the trend in savings. Specifically, I use a trend calculated for 2010-2019, for 2013-2019, for 2016-2019 and for 2018-2019. I start the trend in January of one of the years 2010, 2013, 2016 or 2018 and end the trends in January 2020. I then continue the trends during the pandemic. Figure 3 repeats Figure 2 but adds these counterfactual trends in savings, i.e. how savings would have evolved if households had continued their pre-pandemic savings habits.

Source: FRED of St. Louis Fed and J. Rangvid.
Based on these assumed “normal” (counterfactual) savings levels, I calculate households’ excess savings (defined as the difference between actual savings and the counterfactural savings trends) during the pandemic. Finally, I accumulate them. The results are shown in Figure 4.

Source: FRED of St. Louis Fed and J. Rangvid.
Regardless of the assumed counterfactual, households accumulated a lot of excess savings during the pandemic. At the peak in August 2021, households had accumulated excess savings of around $2000 billion (between $1900 using the 2010-2019 trend and $2300 billion using the 2018-2019 trend). $2000 billion is a lot of money. It corresponds to 8% of US GDP.
Depletion of excess savings
When the Federal Reserve began raising interest rates in 2022 to cool the economy and lower inflation, households had a large stock of excess savings to fall back on. Even when interest rates on car loans, credit cards, student loans, mortgages, etc. went up, households could continue to consume as if nothing had happened. Households had the means to cope with the negative impact of rising interest rates.
For this reason, consumption has been remarkably resilient during this tightening episode. This is evident from Figure 1. Household spending has grown by 0.6% per month since the Fed began raising interest rates in March 2022. By comparison, spending rose by only half as much, 0.3 % per month, in the 2013-2019 pre-pandemic period.
Once again, the whole idea of monetary policy is that economic activity declines when interest rates rise. This has not happened. This time, household spending has risen more than usual, despite a historical tightening period, because households had accumulated all those savings when tightening began.
On the other hand, Figures 3 and 4 also show that households have recently used up their excess savings. Figure 3 shows that savings have been lower for almost two years than they would have been if savings had developed like they normally do, that is like they did before the pandemic. Or, in other words, since 2022 households have consumed more than they otherwise would have.
Figure 4 shows that at the time of writing, i.e. using the latest data from August 2023, households have between $250 billion and $700 billion in excess savings left over from the pandemic.
Based on the 2010-2019, 2013-2019 and 2016-2019 trends, households have reduced their excess savings by about $60 billion per month since the Fed began raising interest rates in March 2022. If this trend continues, households’ excess savings will be depleted in 10-12 months, i.e. in the summer of 2024.
Based on the 2018-2019 trend, households have reduced their excess savings by around $100 billion per month. According to this trend, households will have used up their excess savings in less than three months, as they are currently (August 2023) at $250 billion.
What happens when there is no more surplus savings?
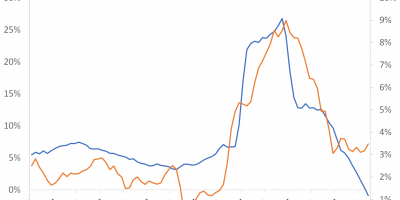
At the moment, US households save very little. Figure 5 shows the savings rate (savings relative to disposable income) for the entire period for which we have data, i.e. since 1959.
At the last observation in August 2023, the savings rate was only 4%. The last time US households saved this little was just before the financial crisis and the terrible recession that followed.

Source: FRED of St. Louis Fed and J. Rangvid.
I am not predicting a recession like 2008, but I am arguing that if US households return to their pre-pandemic saving habits – i.e. a savings rate of, say, 6% – all other things being equal (specifically, assuming no change in income), spending will have to fall by 2% or $400 billion (annualised). Taken in isolation, this means a 1.6% reduction in GDP. This will lead to lower economic activity, even if it does not in itself cause a recession. But remember that this is under the assumption that nothing else will happen. If households want to save more than the assumed 6%, or if income falls, e.g. because of a recession, spending will fall more.
Savings and inflation
The last point I would like to make is that inflation and excess savings have followed remarkably similar trends after the pandemic, as also noted in this paper (link).
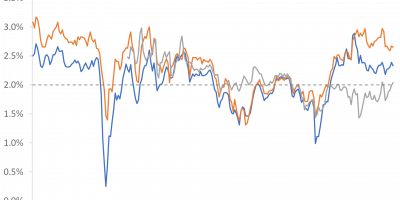
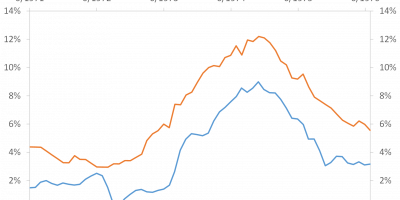
Figure 6 shows excess savings (based on the 2016-2019 trend) and core CPI inflation one year later (note that inflation refers to the 2nd y-axis and the upper x-axis).

Source: FRED of St. Louis Fed and J. Rangvid.
The correlation is striking. Core inflation follows accumulated excess savings with a lag of one year. One year after excess savings started rising in 2020, inflation rose. Excess savings peaked in autumn 2021, as mentioned, and inflation peaked a year later. Since then, excess savings have declined and so has inflation with a one-year lag.
It is tempting to conclude that excess savings caused this inflation episode. As you may recall, I agree that fiscal stimulus (which increased people’s disposable income and thus caused the accumulation of excess savings) contributed to this inflation episode, although I also believe that monetary policy and supply chain challenges played a role (link, link).
Conclusion
Large fiscal transfers combined with lockdowns that restricted household consumption led to a large accumulation of personal savings in the US during the pandemic. When the Federal Reserve raised interest rates after the pandemic to combat sky-high inflation, households were able to draw on their large savings. As a result, consumption, and thus the US economy, has proved remarkably resilient despite the aggressive tightening of monetary policy.
I have analysed the US. This paper (link) shows that developments in household savings were broadly similar in many other countries.
If current trends continue, excess savings will be depleted over the next year, possibly even in the next few months. When this happens, consumption will react. This will weaken economic activity.
Finally, it is striking how inflation has followed the trend in excess savings with a one-year lag, both on the way up and on the way down. If this close relationship continues, inflation will fall further. The high correlation between excess savings and inflation suggests that fiscal stimulus has been an important driver of inflation, at least in the US.