The slope of the yield curve, or the yield spread, has consistently predicted recessions. Following a flattening of the yield curve–a rise in yields on short-dated government bonds relative to yields on long-dated government bonds–the economy often contracts. There are different yield spreads, though. Right now some indicate that we are heading for a recession while others imply low recession probabilities. Which ones should you rely upon and what are the implications? I analyse data from the US and Europe (Germany) and provide answers.
Are we heading for a recession? Currently there are two theories.
Probably: High inflation erodes the purchasing power of households, thereby reducing their consumption possibilities. At the same time, central banks hike monetary policy rates to combat inflation. Proponents of this theory argue that central banks are behind the curve, i.e. need to tighten monetary policy aggressively. Higher rates will increase debt-servicing costs. As rates have to be hiked a lot, the effect will be significant, proponents of this theory argue. Bond and stock prices will fall when rates rise, reducing people’s savings. In addition, elevated uncertainty following the war in Ukraine makes firms and households nervous, causing them to save more. In total, a recession seems unavoidable.
Probably not: Underlying economic growth is strong. The recovery from the pandemic was strong during 2021. Pent-up demand from the pandemic, coupled with high savings rates during the pandemic, means that households have the will and the money to spend. Furthermore, real rates will remain negative in spite of rising nominal rates, because inflation is so high. Negative real rates support aggregate demand. Growth will be lower than we expected just a few months ago, because of the reasons mentioned in the previous paragraph, but we will avoid the recession.
Both stories appear reasonable. Which one should we believe?
In my book, I examine a host of variables used to predict recessions (link). I conclude that the yield spread, also referred to as the term spread or the slope of the yield curve, i.e. the difference between yields on long- and short-dated government bonds, has been a reliable predictor of recessions. In normal times, during expansions, the yield curve is upward sloping: Yields on long-dated bonds are higher than yields on short-dated. Prior to recessions, however, short yields rise relative to long yields. Following a flattening of the yield curve, the economy often starts contracting.
There are different versions of yield spreads, though. Some people prefer to subtract the three-month yield from the ten-year yield, while others prefer to subtract the two-year yield from the ten-year. Some prefer to look at thirty- and five-year yields. And so on. Which one should we use?
This seems nerdy. Currently, however, it is important because you get different answers depending on your choice of preferred yield spread.
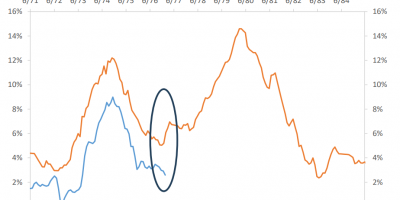
Figure 1 shows two widely-used US yield spreads since the end of the spring 2020 recession, i.e. since the summer of 2020: The US ten-year yield minus the US two-year yield (10y-2y) and the ten-year yield minus the three-month yield (10y-3m).

Data source: Fed St. Louis Database.
The ten-year minus three-month spread (‘10y-3m’) has trended upwards during the past two years. Today, the yield on a ten-year US government bond is almost two percentage points higher than the yield on a three-month government bill. Recessions typically occur when short-term yields rise relative to long-term yields, i.e. when the difference between ten-year and three-month yields approaches zero and the yield curve becomes flat. Currently the ten-year and the three-month yields are far from being identical. This indicates that we are not heading towards a recession. Based on this calculation of the yield spread, the New York Fed estimates that the probability that the US economic will be contracting one year from now, i.e. in February 2023, is only 6% (link).
The ten-year minus two-year yield spread (‘10y-2y’) behaves opposite. It has trended downwards since summer 2021. It is approaching zero. FT’s Unhedged mentions that Capital Economics estimates the recession probability to 20% using the 10y-2y spread (link). We are heading for a recession, people who watch this indicator say (link, link).
Given the importance of recessions for households, firms, governments, and markets, it is confusing that the bond market sends these different signals.
US historical evidence
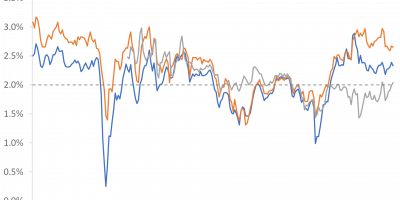
Should we trust the 10y-3m spread (which currently says we are not approaching a recession) or the 10y-2y spread (which says we are heading for a recession)? Let us look at the historical evidence. Figure 2 shows the two yield spreads, together with vertical columns indicating recessions in the US, since the early 1950s when the Fed started using interest rates to influence inflation and economic activity.

Data source: Fed St. Louis Database.
The first important conclusion emerging from Figure 2 is that recent developments are highly unusual. Normally, the two yield spreads correlate and send similar signals. Over the full period, their correlation is 0.75, i.e. high. For example, both yield spreads fell prior to the 1973, the 1990, the 2000, and the 2008 recessions. The situation today, where the two spreads send different signals, is highly unusual.
Second, yield spreads have historically predicted recessions. The tendency that the yield curve flattens prior to recessions is robust. Again, yield spreads dropped prior to the 1973 recession, the 1990 recession, the 2000 recession, the 2008 recession, etc.
Third, and probably the most important conclusion here, the 10y-3m yield spread is the more reliable indicator. The two spreads are correlated, but not perfectly correlated. Starring closely at Figure 2, you see that the 10y-3m spread sends stronger signals. The drop in yield spreads prior to recessions is simply clearer for the 10y-3m spread.
As this last point is important, I examined it further. I looked at the predictive power of yield spreads for economic growth, instead of the narrow ‘yes/no’ recession question. I calculated for every quarter the cumulative economic growth over the following four quarters. I.e., for Q1 1953, how fast did the US economy grow (in real terms) from Q1 1953 to Q1 1954? And so on. Then I examined if the yield spread has predicted economic growth one year ahead. I ran the regression:
Economic growth next four quarters (t→t+4)
=
constant + coefficient ∙ yield spread(t).
I ran two versions of this regression. In the first, I use the 10y-3m yield spread as the explanatory variable. In the second, I use the 10y-2y spread. The results from the first regression are:
Growth = constant + 0.70∙(10y-3m)
t-statistic = 5.3
R2 = 9.5%
The results from the second regression are:
Growth = constant + 0.55∙(10y-2y)
t-statistic = 1.4
R2 = 0.7%
These results tell us that the 10y-3m yield spread has been a significant predictor of future economic growth, while the 10y-2y spread has not.
In more detail, the first regression tells us that–over the 1953-2022 period–economic growth has been 0.7%-points lower the following year in response to a 1%-point drop in the 10y-3m yield spread. The relationship is statistically significant (the t-statistic is 5.3, exceeding the critical value of 1.96). Variation in the 10y-3m yield spread has captured 9.5% of the variation in one-year ahead economic growth (R2 = 9.5%). Basically, a fall in the 10y-3m yield spread has signalled lower economic growth ahead.
(For the academics: I am aware of the fact that there are overlapping observations in these regressions (quarterly observations and annual growth rates), which inflate t-statistics and R2s (link). For many years, I worked with these issues in return-predicting regressions. Based on this experience, I am confident that the conclusions here would not change if I did the statistical refinements. If this were an academic article, I would do the statistical refinements. This is a blog, so you will have to live with standard OLS regressions.).
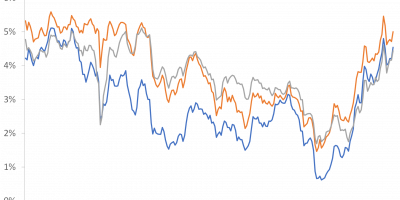
In Figure 3, I show the 10y-3m yield spread and one-year ahead economic growth. The 10y-3m yield spread often captures significant drops in future economic activity. During 1973, the late 1970s, 1990, 2000, and other periods with drops in the 10y-3m yield spread, economic activity subsequently contracted.

Data source: Fed St. Louis Database.
The second regression, on the other hand, tells us that the 10y-2y yield spread has not been a reliable predictor of future economic growth. The regression coefficient is insignificant and the R2 close to zero. Simply, over the past 70 years, there has been no systematic relationship between the 10y-2y spread and future economic growth.
By the way, I also ran the regression for the 30y-5y yield spread that people also talk about these days (link). The 30y-5y spread is also insignificant when it comes to predicting one-year ahead economic growth.
I conclude that the US 10y-3m yield spread has been a consistent predictor of future US economic growth throughout the past 70 years while the 10y-2y (and the 30y-5y) yield spread has not.
The current 10y-3m yield spread is 2% (Figure 1). If history is any guide, the current 10y-3m spread indicates that the recession is not right in front of us.
Evidence from Europe
So, the 10y-3m yield spread has been the better predictor of future economic activity in the US. What about Europe? Is the European economy heading towards a recession? To answer this, I look at Germany.
I can get data on German 10y-3m and 10y-2y yield spreads since 1980. I thus run my predictive regressions of one-year ahead German real economic growth on German yield spreads for the 1980-2022 sample.
Results are similar to those for the US. The 10y-3m German yield spread has correlated with 1-year ahead German economic growth, while the 10y-2y yield spread has not.
The results are:
Growth = constant + 0.62∙(10y-3m)
t-statistic = 3.9
R2 = 8.7%
and
Growth = constant + 0.32∙(10y-2y)
t-statistic = 1.26
R2 = 1.0%.
Similar to the US results, the German 10y-3m yield spread has been a significant predictor of future economic growth in Germany, while the 10y-2y yield spread has not. Historically, economic growth in Germany has been 0.62%-points lower over the following year, if the German 10y-3m yield spread has fallen by 1%-point. Movements in the 10y-2y yield spread have not systematically predicted future economic growth.
Today, the German 10-year yield is more than 1%-point above its 3-months counterpart. Indeed, the 10y-3m yield spread has been widening during recent months, as Figure 4 shows. The figure shows daily movements in the 10y-3m German yield spread since early 2020.

Data source: Datastream via Refinitiv.
If history is any guide, yield spreads indicate that we are not heading towards a recession in Germany either.
Is this time different?
Perhaps history is not a guide this time around. Historically, central banks have hiked rates during late stages of expansions, when inflationary pressures started mounting. Short rates increased relative to long rates. The yield curve flattened. The rise in short rates, resulting from higher monetary policy rates, lowered aggregate demand and economic activity contracted in the end.
Today, inflation is running at 8% in the US and Europe. Monetary policy rates are still at rock bottom, however, causing a high 10y-3m spread. High inflation and expectations of tighter monetary policies push up yields on two-, three-, and five-year bonds, causing a flat 10y-2y spread. Eventually, monetary policy rates will rise, and the 10y-3m spread will flatten, too.
The 10y-2y spread thus indicates that inflation is sky high and monetary policy rates are expected to rise, resulting in a recession. The 10y-3m spread says that monetary policy rates are still superlow, so no recession ahead.
Conclusion
The economic outlook is clouded. Few people disagree that inflation, monetary policy tightening, and uncertainty resulting from the war in Ukraine will lower economic growth going forward. The big question is ‘how much’. Will growth remain positive or will we enter a recession?
The yield spread is the difference between yields on long-dated and short-dated government bonds. There are, however, many different long-dated bonds, and many different short-dated bonds. Which ones should we use when we try to forecast economic activity?
I have examined two widely-used spreads. The difference between the yield on a ten-year bond and a three-month bill (10y-3m), and the difference between a ten-year bond and a two-year bond (10y-2y). I have looked at the US and Germany.
The 10y-3m yield spread has been a consistent and reliable predictor of one-year ahead economic growth during the past seven decades. The 10-2y yield spread has not. If history is a guide, we should pay most attention to the 10y-3m yield spread. Today, this spread indicates that we are not heading for a recession. This goes for the US and Germany.
Perhaps this time is different, though. Perhaps central banks are so much behind the curve that the 10y-2y spread is a better predictor this time around. If so, take care. The 10y-2y spread indicates that the recession is near.
What is my own assessment? It is a difficult call but I lean towards the ‘No recession in 2022’ outcome. This, by the way, is in line with the signal from the 10y-3m yield spread. The underlying economy is strong and supported by booming labor markets and very low monetary policy rates. Growth will be considerably lower than we expected just a few months ago, but there is a decent chance we will avoid the recession this year. The main risk, in addition to the war in Ukraine, is that central banks are behind the curve implying that rates must be hiked aggressively. The latter is unfortunately not a zero probability event.