What happened on the oil market this week was completely crazy.
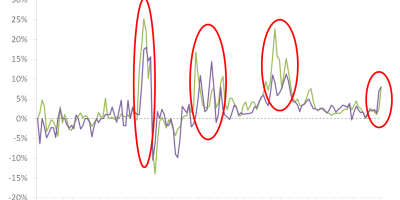
I believe everybody noticed the headlines, but it is worthwhile to pause and reiterate, as this was another sign of the very unusual and severe recession we are going through: For the first time in history, oil prices were negative at minus USD 38 for a barrel of oil. I think this graph nicely illustrates how unusual this was.

Data source: Thomson Reuter Datastream via Eikon.
The graph shows daily changes in oil prices since 1983. Until April 16, the average daily price change is 0.03%. The standard deviation of daily price changes is 2.5%. On April 20, Monday, the price of oil fell by 306% compared to its price Friday. This is a 121-sigma fall. Almost surreal, but true.
The price of oil fell because demand for oil has tanked as a result of the recession. When economic activity falls, as it does right now, demand for oil falls. When we do not travel, when we do not drive our cars to work, when production facilities are closed down, and so on, we do not use oil. When supply of oil is not reduced, or at least not reduced as much as demand for oil falls, prices adjust.
If oil is produced but not used, it needs to be stored somewhere. Traders panicked on Monday, as they feared that there is simply not enough physical space to store oil. If you possess thousands of barrels of oil and have nowhere to store them, you are willing to pay somebody to take care of it. FT explains it nicely: “Analysts believe a lack of available storage capacity at the WTI contract’s delivery point of Cushing, Oklahoma — known as the Pipeline Crossroads of the World — set off panic among traders holding derivative contracts, who found themselves with nowhere to put the oil.”
The negative price of oil relates to West Texas Intermediate, the US benchmark oil contract. The price of Brent oil, the international benchmark, has been positive, even on Monday at USD 17 per barrel. This indicates that Monday’s event was more of an issue with storage of oil in the US, and the expiration of futures contracts, than a general issue with storage of oil. E.g., Brent oil can more easily be stored at sea, at least as long as tankers are available. One should also notice that the price of WTI was back in positive territory already Tuesday and stayed positive during the rest of the week. This was, even if very dramatic, a one-day shock.
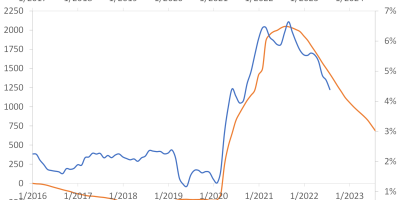
Prices of both WTI and Brent have been falling since the outbreak of the virus in China in early 2020, however, particularly in early March when Europe and the US started shutting down. Except from the astonishing event on Monday, the price of both Brent and WTI have followed the same path. The agreement from April 10 limiting oil production has thus failed to slow the fall in oil prices.

Data source: Thomson Reuter Datastream via Eikon.
The behavior of oil prices reflects the severity of this crisis. The drop in oil prices since the start of the year tells a different story about the recession than does the stock market. The stock market has sprinted ahead since mid-March, indicating that stock market investors believe the recession will soon be over (the stock market did fall on Monday and Tuesday, though, due to the turmoil on oil markets). Oil markets, in contrast, indicate that the recession is very much still ongoing. What signal do you believe – the one from the oil market or the one from the stock market?