
Over the past 150 years, inflation has generally been low. However, there have been four episodes of high inflation: the First and the Second World Wars, the 1970s and the current post-pandemic inflation flare-up. In three of these episodes there were very large budget deficits and a rapidly growing money supply. The fourth phase – the 1970s – was characterised by rapidly rising oil prices.
It is often instructive to study long-term historical data to gain insight into important current events. Today I examine inflation over the last 150 years in the UK and the US to see what we can learn from it about the current inflationary environment.
Historically, inflation has typically been low. In the last 152 years since 1870, there have for instance only been 25 years when inflation has been above 5%. This means that inflation was below 5% in four out of five years. In 2022, inflation in the US was 8%. In the last 152 years, inflation has only been this high in 12 years. So, the current high inflation rates are very unusual, but can we identify common features of periods of high inflation?
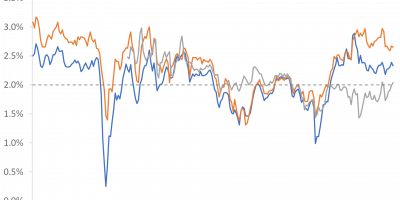
Figure 1 shows that there have been four periods of high inflation in the UK and US over the last 150 years:
– The First World War
– The Second World War
– The 1970s
– The current post-pandemic period.
Before and between these inflationary periods, inflation fluctuated around zero.

Data source: Jordà-Schularick-Taylor Macrohistory Database, updated to 2022.
Before the outbreak of the First World War, inflation was low and often negative. The same applies to the interwar years.
In contrast, inflation was very high during the two world wars.
Since the Second World War, there have been very few years with deflation. This is a good thing because businesses postpone investment and households postpone consumption in deflationary times. Economic activity suffers when prices fall.
Today, inflation is very high. In 2022, the inflation rate in the US was 8%. Since 1945, there have only been seven years when inflation was this high. Why is inflation so high today, and does today’s situation have similarities with previous periods of high inflation?
The first two inflationary periods were fundamentally different from the last two. The first two were due to wars, while in the 1970s energy prices skyrocketed. The current inflation spurt is due to the pandemic. The response to the pandemic was very expansionary policies that stimulated demand even though there were few goods to buy because supply-chains were impaired (link). The result was inflation.
Despite their fundamental differences, the episodes nevertheless have some interesting economic similarities.
Public deficits
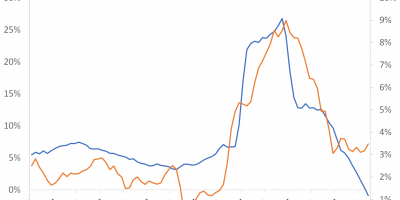
One common feature is the behaviour of government finances. The two world wars and the pandemic were accompanied by large government deficits. Figure 2 shows the UK and US government budget deficits (as a percentage of GDP) year on year.

Data source: Jordà-Schularick-Taylor Macrohistory Database, updated to 2021.
Apart from the two World Wars, governments were generally able to balance their budgets until the 1960s. The wars caused very high public spending, though, and, as Figure 2 shows, public deficits increased dramatically. In 1917 and 1918, deficits in both the UK and the US were exceeding 15% of GDP. In 1952 and 1947, deficits in the US were over 10% of GDP, and in the UK this was the case in 1940. As Figure 1 shows, inflation was also high during these periods.
The pandemic response also led to very high government deficits, exceeding 15% of GDP in the US in 2020 and 2021, and 15% in the UK in 2020 and 8% in 2021. In fact, deficits in the US have exceeded the 2020 level only four times in the past: in 1919 (17%), 1944 and 1945 (21%) and 1943 (27%).
These stylised facts at least point to a correlation between very high government deficits and inflation. However, the correlation is not perfect. While government deficits flared up during World War I, World War II and the pandemic, deficits were not unusually high in the UK in the 1970s, although inflation was very high. A big hole in the government budget is not the only thing that causes inflation.
Similarly, a large government deficit does not necessarily lead to runaway inflation. In 2009, the government deficit was 13% in the US and 10% in the UK. Many people feared inflation, but that was not the case. Inflation remained subdued during and after the financial crisis.
Money supply
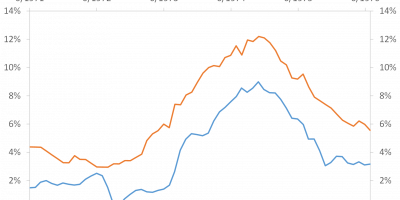
One possible reason why inflation remained subdued after the 2008-09 financial crisis, despite high public deficits, but rose sharply during the First and Second World Wars and the pandemic, when deficits were also high, has to do with the behaviour of money. There were large government deficits during World War I, World War II, the financial crisis and the pandemic, and the money supply was also greatly expanded during World War I, World War II and the pandemic. However, as Figure 3 shows, the money supply did not expand dramatically at the time of the financial crisis in 2008.

Data source: Jordà-Schularick-Taylor Macrohistory Database, updated to 2022.
Figure 3 shows the annual growth rate of the broad money supply in the UK and the US. During the First World War, the Second World War and in 2020, the money supply in the US increased rapidly, precisely during the periods when inflation also increased dramatically and public deficits were sizeable. Similarly, the money supply in the UK increased significantly during World War I, World War II and the pandemic, the same periods when inflation was high and public deficits were large. Interestingly, the money supply in the UK also grew rapidly in the 1970s when inflation was also high.
Admittedly, the growth rate of the money supply is volatile, making it difficult to filter out signals from noise. However, there are indications that inflation is high when government deficits are large and the money supply is growing rapidly
The 1970s
The simultaneous occurrence of large government deficits, a rapidly growing money supply and a burst of inflation is characteristic of World War I, World War II and the pandemic. During the financial crisis of 2008, the public deficit was substantial, but the money supply did not expand due to bank failures, and there was no inflation.
So that leaves the 1970s. The money supply grew rapidly, but not extremely. Government deficits were substantial, running at 5-7% in the US, but they did not “explode”. Nevertheless, we experienced several rounds of inflation in the 1970s. The reason, of course, is the oil price shock.

Data source: FRED St. Louis Fed database.
Figure 4 illustrates the monthly percentage changes in the price of oil. Of note is the shock in the early 1970s when the price of oil more than doubled from one month to the next. As oil was much more important at that time, this had far-reaching consequences for the economy and inflation.
This does not mean that everything in the 1970s was due to oil. Other factors also contributed to inflation, as explained in this article (link). Large but not super large government deficits and rapid but not super rapid growth in the money supply led to inflation as energy prices rose. This combination of rising oil prices, large fiscal deficits and expansionary monetary policy sounds like the pandemic. However, oil is not as important today, so we attach less importance to oil prices as an explanation for inflation than we did in the 1970s.
Why is the combination of high budget deficits and expansionary monetary policy so dangerous for inflation?
Debt cannot continue to grow, and at some point the debt-to-GDP ratio has to be stabilised. There is a hard way, which is to cut spending and/or raise taxes. But there is also a softer way, namely to increase inflation. This reduces the real value of debt if nominal interest rates do not follow inflation. One way to prevent interest rates from rising is to expand the money supply. An increase in the money supply lowers the price of holding money, i.e. the interest rate.
As can be seen from Figure 2, public deficits were large during the First and Second World Wars, the 1970s and the pandemic. Logically, one would expect a rise in debt to lead to a rise in interest rates (nominal and real), but because inflation rose so much (and nominal interest rates did not follow), real interest rates fell during the inflationary episodes, reducing the burden of higher debt during these periods. This happened during the four inflationary periods, as Figure 5 shows.

Data source: Jordà-Schularick-Taylor Macrohistory Database, updated to 2022.
This means that it is bondholders, not taxpayers, who pay the price for rising debt and high inflation, as their real returns are eroded. This conclusion is consistent with that of Hall & Sargent (2022, link), who show how inflation was the biggest driver of the reduction in the debt-to-GDP ratio after World War II and how bondholders suffered as inflation rose. The same thing seems to be happening now. Bondholders are paying the price for the huge expansion of government debt during the pandemic, as policymakers allowed inflation to flare up while interest rates failed to follow inflation on its way up.
A final comment on the 1920s. This is an interesting episode because inflation flared up at the end of the First World War and immediately afterwards. However, in the early years of the 1920s, prices fell dramatically in response to the recession of the early 1920s. Nevertheless, as Hall & Sargent note (2022, link): “After the First World War, the price level peaked in 1919 at more than 70% above the pre-war level. Although the price level fell during a deep but brief depression from 1920 to 1921, 10 years after the war it was still 55% above the 1914 level.” Despite the severe deflation in the early 1920s, bondholders eventually paid for the large expansion of government debt with low real yields for holding government bonds.
For the post-WWII period, Hall & Sargent find that inflation was responsible for 71% of the post-war decline in the debt-to-GDP ratio! The question is whether this is what is happening in these years: Inflation may be the only way governments can lower debt levels that have risen dramatically after the financial crisis and the pandemic.
Conclusion
Normally, inflation is low. In the last 150 years, inflation has been as high as it is today in less than one out of ten years (12 out of 152 years).
Sometimes, however, inflation rises. In the last 150 years there have been four episodes of high inflation: the First World War and II, the 1970s and the post-pandemic period.
I have presented some correlations that characterise the four inflationary periods.
Often inflation is high when government deficits are large and the money supply is expanded. High inflation reduces the real value of debt, helping to stabilise the public debt/GDP ratio when interest rates do not rise as much as inflation. Expansionary monetary policy (expanding the money supply) keeps interest rates in check during periods of high government deficits. Bondholders thus pay the price of high government deficits, as the real returns on bond investments fall during periods of high inflation, high deficits and high money supply growth.