How will this recession play out and how will the recovery look? Will we get a short recession with a fast rebound (V), will we get a longer recession before the recovery (U), will we get a new lockdown in autumn resulting from a second wave of the Corona virus (W), or will economies remain depressed for a long time (L)?
Nobody knows, particularly this time around when the shape of the recovery will be determined by a virus and how this develops.
Supporting the V-shaped recovery, this recession is not caused by economic imbalances, such as an overvalued housing sector, too much debt, a fragile banking sector, or the like. Also, we know from history that recessions last longer and are deeper if they are caused by financial crises. This is also not the case this time around, in contrast to 2008, for instance. This means there is hope for a reasonably fast rebound, if we manage to get the virus under control.
On the other hand, if we get a second outbreak, e.g., in autumn, and economies are shut down again, the path of economic activity will probably take the shape of something like a W.
What we do know is that the depths of the recession is unprecedented. The fall in economic activity and the increase in unemployment is mind-blowing, and very scary (link).
This makes one fear that the recession could drag out. When economies open up, it will take time to find jobs for those who get unemployed during the recession. Firms will probably be reluctant making new investments until we have a vaccine. Consumers want to go to restaurants, cinemas, on vacation etc., but will probably hold back until they feel on safe ground, too. Uncertainty abounds.
In this environment, one would imagine that the stock market suffers tremendously. With a recession impeding, and with so much uncertain surrounding the future path of economic activity, one would imagined that stock markets, like economic activity, would be in freefall. This is not the case.
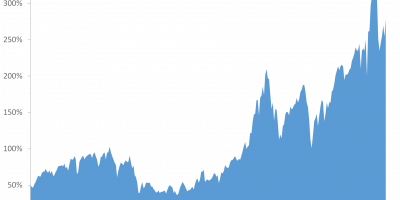
In the beginning of the lockdown, the stock market tanked. It was the fastest bear market ever (link). It reminded us very much about the dark days of autumn 2008. This graph shows the SP500 on a daily basis during the 2008 financial crisis and this crisis. “0” in the figure is September 19, 2008, respectively February 21, 2020.

Data source: Fed St. Louis Database.
Financial markets were in stress in mid-March, when even yields on safe assets increased (link). Fearing a replay of 2008, central banks and governments came to the rescue, and the stock market started its recovery. Since the bottom on March 23, the S&P 500 has gained an astonishing 28%. This is remarkable, given all the uncertainties and the depth of the recession. The contrast to the autumn of 2008 is stark. The stock market kept on falling throughout 2008 and early 2009, only to start its recovery in March 2009.
The stock market seemingly believes this recession will result in a V-shaped recovery. Let’s hope it is right. One might fear that it is not.