What is the likelihood that we will see high inflation? What is the likelihood that we will see deflation? What is the likelihood that the stock market will crash? And what is the likelihood that it will continue rising? How likely is it that real estate prices will fall, and how likely is it that they will rise? And what about the exchange rate? Find the answers to these questions in this summer story.
It’s summer time. Hopefully you are lying on the beach enjoying the feeling that normal times are returning as vaccines are rolled out (I will in this post not talk about the fact that they are mainly rolled out in Europe and the US and what this implies for global inequality and the fear that new mutations will develop). While lying here, you might be thinking about some of the current big questions in economics:
- Will all the expansionary policies lead to inflation?
- Will the stock market crash, or keep doing fine?
- What about your house? Have real estate prices risen so much during the past year that house prices will revert?
- And so on.
In this summer reading, I will not present my own views on this (that is for another day), but merely tell you what the market expects. I still think this provides some interesting insights.
The Federal Reserve Bank of Minneapolis maintains this great database with market-based probabilities of different events (link). I will pick some of these events and discuss them.
Based on the prices of different types of derivatives, the Fed backs out the probability that some future event, e.g., a stock market crash, will happen. These probabilities are those that traders of the derivatives implicitly assign to the events. Given that derivatives are traded every day, we can back out probabilities every day. We can thus study the time-series developments in the probabilities, i.e. whether it has become more likely or not that the stock market will crash, for instance.
I will show time-series of probabilities since January 1, 2019, i.e. during the past 2.5 years. This will give you a feeling for how these probabilities behaved before, during, and after corona. Given that these data are from the Fed, most of them deal with US events, but I also include the euro-dollar exchange rate.
How likely is it that we will have high inflation?
Probably the most pressing theme for markets these days is whether inflation is here to stay or whether it is temporary. As you know, inflation in the US has been running at close to 5% during recent months, because economic activity is returning after the pandemic, supply-chain bottlenecks, etc. But monetary policy is also very expansionary and the same goes for fiscal policy. So, will inflation revert to the target rate of 2% or will inflation remain high?
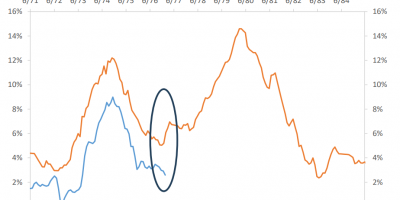
Figure 1 shows the market-based probability that inflation in the US will average above three percent over the next five years. As is clear from the figure, market participants view this as becoming more and more likely.

Source: Fed Minneapolis.
I think this is an interesting graph. Expectations of high inflation started rising already in spring 2020, after the market turmoil, but really took off after the US election (as I described here, link). A couple of months ago, market participants viewed it almost as likely that we would see average inflation above 3% for five years as we would not (the probability was close to 50%). Since then, probabilities have come down somewhat. Currently, markets believe there is a 32% probability of high (above 3%) inflation over the next five years.
Notice also that market participants attached basically zero probability to inflation exceeding 3% at the peak of the market turmoil in March 2020.
The likelihood of deflation
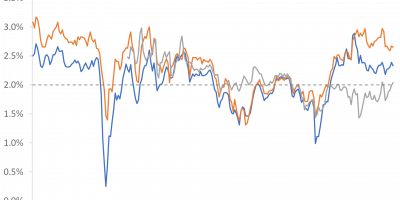
A probability distribution has an upper and a lower tail. To evaluate the likelihood of the upper tail happening, the Fed shows us the probability that inflation will exceed 3%. This is Figure 1. To evaluate the likelihood of the lower tail happening, the Fed shows us the likelihood that inflation over the next five years will average below -1%, i.e. deflation over the next five years. Currently, market participants view this as unlikely. They assign a 5% probability to this event, as Figure 2 shows.

Source: Fed Minneapolis
Figure 2 also shows how afraid markets were at the peak of the coronacrisis in March last year. Market participants feared that the economy would run into serious setbacks, and inflation would suffer. In March 2020, markets believed that it was more likely than not those prices would be falling over the next five years. The implied probability of -1% inflation over the next five years was as high as 85%! Since then, the assessed likelihood that we will see deflation has come down.
In total, today, markets believe there is a substantial probability that we will see high inflation in the future and a low probability of deflation.
Stock prices
Lying at the beach, you might be thinking about the stock market. It has been a marvelous rebound, but many believe that the bull-market starts to look tired. What do financial markets think?
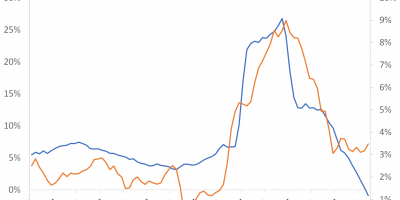
Figure 3 shows the implied probability that the SP500 will fall by 20% over the next twelve months and the likelihood that it will rise 20%. The graph thus collects both the upper and the lower tail probabilities.

Source: Fed Minneapolis
Today, markets believe it is more likely that the SP500 will fall by 20% than it will rise 20%. The likelihood today (July 2021) of a 20% fall is 13% and the likelihood of a 20% rise is 8%. Markets believe the risks are tilted to the downside. I tend to agree.
Notice also what happened in March last year. Form one day to the next, moods changed. Prior to March 2020, markets believed that it was more likely that the SP500 would fall. Right after March 2020, i.e. right after the stock-market crash in March 2020, markets believed it was more likely that the SP500 would rise. The implied probability of a larger than 20% increase in the SP500 jumped from less than 5% in February 2020 to almost 35% in mid-March. Market participants got that right. If one had bought stocks in March 2020, one would have harvested great returns.
Real estate prices
House prices have surprised us during this recession. Typically, house prices fall during recessions. During this one, house prices have been rising. Many people wonder what will happen from here (at least many people ask about my opinion – I hesitate coming with strong statements). In many countries, authorities discuss whether house prices have been on an unsustainable path and whether some kind of macroprudential regulation is needed. If this is a temporary spike, perhaps there is no need for intervention. If not, the case for intervention is stronger. My opinion is that one should be reluctant to base interventions on forecasted house price movements, as we often get it wrong. Nevertheless, it is relevant to know what financial markets think.
Figure 4 shows implied probabilities of US real estate prices rising, respectively falling, by more than 10% over the next three months.

Source: Fed Minneapolis
Markets view it as more or less equally likely that real estate prices will drop as they will rise. The distribution is symmetric.
Again, something interesting happened in March 2020. All of a sudden, because of the pandemic, the mass at the tails of the distribution increased. The likelihood of extreme outcomes (real estate prices dropping or rising by more than 10%) increased. Markets became nervous.
Since April 2020, the implied likelihood of large changes in real estate prices has dropped. Market participants expect more peaceful times ahead on the real estate market.
Euro/dollar exchange rate
As the final tail event, let us look at the likelihood of a large change in the Euro/dollar exchange rate. This shows a very different pattern to the ones presented until now.
The likelihood that we will see large changes in the exchange rate is in Figure 5. The figure shows the assessed probabilities that the Euro/dollar exchange rate will rise or fall by more than 10% over the next three months.

Source: Fed Minneapolis
Before March 2020, i.e. before the pandemic, markets predicted nothing. There was a zero percent probability of a large move in the euro/dollar rate. My interpretation is that markets know that it is difficult to predict exchange rates in normal times, more difficult than predicting stock prices and interest rates, which is certainly difficult enough.
At the peak of the turmoil in March last year, also FX markets reacted. Market participants became more uncertain about future movements in the exchange rate. Markets increased the likelihood that we would see large movements in the exchange rate market going forward. Markets were uncertain whether the dollar would weaken or strengthen, but were afraid that large movements would happen (true, the implied probabilities at the peak were still low compared to those in Figure 1-4, at less than ten percent, but the jump from zero percent before the pandemic is noteworthy).
Markets calmed down quickly, but it lasted until autumn before the probability distribution had obtained its pre-pandemic form, with zero probability of either a large fall or increase in the exchange rate.
Conclusion
From derivatives prices, one can back out the assessed probability that certain events will happen. This can be useful information for people thinking about the future.
These probabilities are not always good predictors of future outcomes. An increase in a market-based probability might not necessarily imply that the likelihood that the event will in fact happen has increased. Still, these probabilities tell us what market participants expect, and this can be useful knowledge in itself.
Personally, I think it is particularly interesting how inflation probabilities have moved around over the past year. Before the pandemic, people expected very low inflation in the years to come, perhaps even deflation. Today, many people expect significant inflation. I think I will use the summer pondering this.