
What caused this inflation catastrophe? Supply shocks, expansionary fiscal policy, expansionary monetary policy, excess savings, energy price shocks, tight labour markets…? Or was it money? The correlation between a huge expansion of the money supply and subsequent inflation is striking, but did other factors cause this? Furthermore, if the monetary theory is correct, then we should expect severe deflation – rapidly falling prices – in the coming months. I very much doubt that.
I have written many analyses of this inflation shock (collected here: link). But I have – so far – not explicitly analysed the role of the money supply. Have I overlooked something?
Nobel Prize winner in economics (1976), Professor Milton Friedman of the University of Chicago, once said the now famous words:
Inflation is always and everywhere a monetary phenomenon.
This summarises the main idea of monetarism. The starting point is the so-called quantity theory of money:
M ∙ v = P ∙ Y,
where M is the aggregate supply of money in the economy, v is the velocity of money (the number of times a unit of currency, e.g. one USD, is spent on the purchase of goods and services), P is the price level and Y is real economic activity.
Velocity v means that if 100 USD are in circulation, but 200 USD are spent on goods and services, velocity is 2; each USD is used to purchase two USD worth of goods and services. It is usually assumed that velocity is exogenous, i.e. not influenced by monetary policy.
Monetarists assume that real economic activity, Y, is caused by real factors such as population growth, productivity growth, etc., i.e. Y is also determined independently of monetary aggregates.
If v and Y are unaffected by the money supply, every change in M leads to an equally large change in P, the price level. Inflation, i.e. the change in the price level, is caused by growth of the money supply, according to monetary theory.
Recent evidence on money and inflation
For many years, the monetary theory of the price level has been neglected by economists. During this episode of inflation, it seems to have struck back.
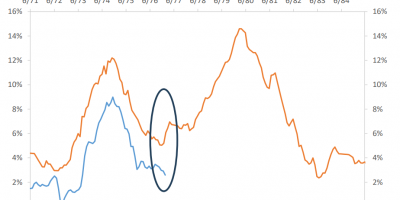
Take the USA first. Figure 1 shows the annual growth rate of the US money supply (M2), forwarded 15 months, together with US inflation.
Immediately after the outbreak of the pandemic, the money supply grew at the highest rate since the Second World War. Inflation then erupted, reaching levels not seen since the 1970s.
After its expansion, the growth rate of the money supply fell rapidly. Soon afterwards, inflation also fell.
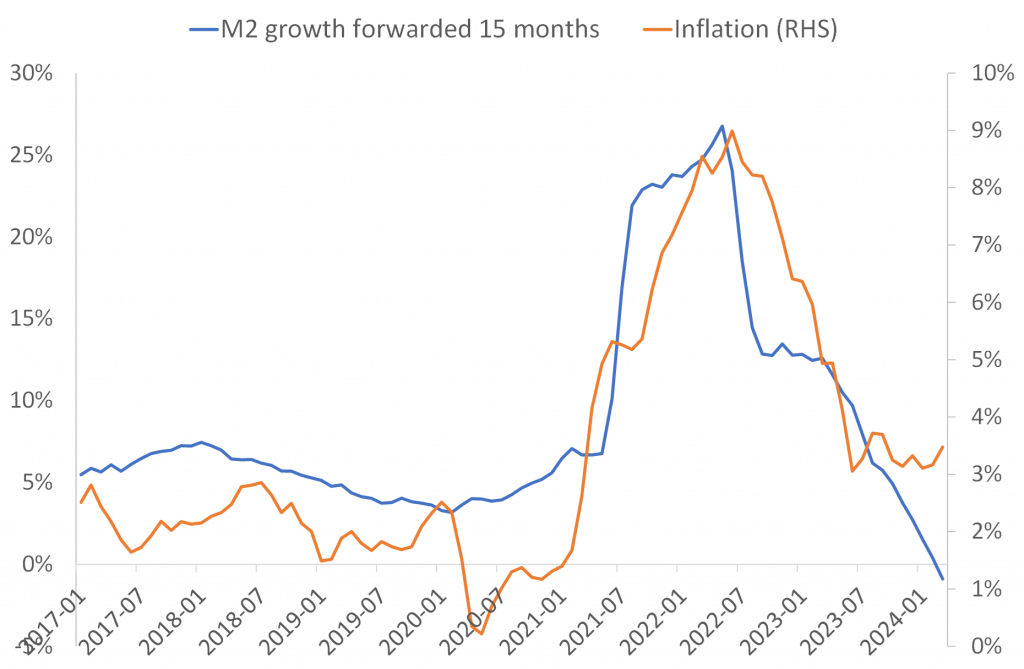
Figure 1. Annual percentage growth in US aggregate money supply (M2) forwarded 15 months together with US CPI inflation. January 2017 – March 2024. Data source: St. Louis FRED and J. Rangvid.
The correlation between money supply growth and subsequent inflation is striking. It seems that money fuelled inflation. Just as the traditional monetary theory of the price level predicts.
This was not just a US phenomenon, even if the situation in the US was extreme. This Banque de France analysis (link) shows how the money supply in Europe also grew very quickly. And in Europe, of course, there was also an inflationary catastrophe. The growth rate of the money supply was higher in the US, but it was also unusually high in Europe.
A one-time correlation?
For a theory to be valid, it must be solidly underpinned. That is the challenge here.
Monetary theory states that the relationship between money supply growth and inflation always exists and goes in both directions.
Look at Figure 2, which extends Figure 1 with data going back to the early 1960s, where the monthly money supply growth data begins, and extending to 15 months after March 2024, that is June 2025.
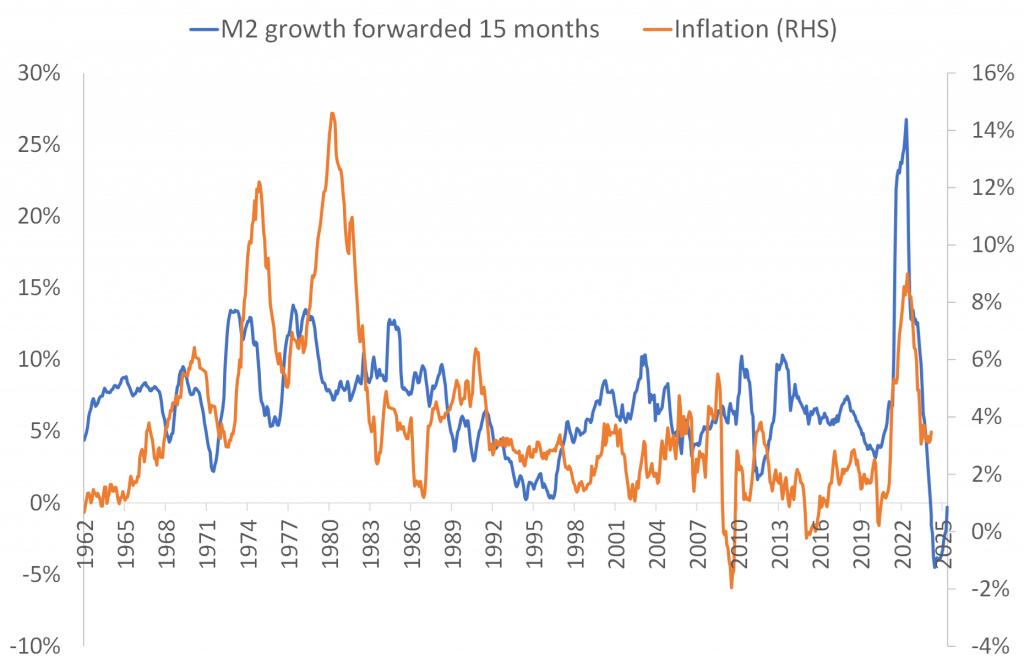
Figure 2. Annual percentage growth in US aggregate money supply (M2) forwarded 15 months together with US CPI inflation. January 1962 – June 2025. Data source: St. Louis FRED and J. Rangvid.
While Figure 1 shows a remarkably strong correlation between money supply growth and subsequent inflation during this inflationary episode, Figure 2 illustrates that this was a one-off event. Until the pandemic, there was virtually no correlation between money supply growth and subsequent inflation, maybe with an exception during the early 1970s. This is, of course, why economists had discarded the theory; it had little empirical support.
Severe deflation
You might counter that Figure 2 shows that the rate of money growth was historically high immediately before this inflation shock, and that with such a high money growth rate, inflation should respond. All well and good. But the argument is double-edged.
If money supply growth should cause inflation when money supply growth is unusually high, then the logical consequence must be that money supply growth should also cause low inflation/deflation when money supply growth is very low. And indeed, money supply growth has been historically low recently. In fact, the money supply has shrunk for the first time in sixty years.
Figure 2 shows that there has never been a negative growth rate in the money supply – where “never” means as long as there has been monthly data, i.e. since the early 1960s. We should have deflation, but we have not. Instead, we have too much inflation. Moreover, deflation should peak in the next few months, according to the monetary theory. Since M2 shrank at an annual rate of almost 5% a year ago, with the 15-month lag that correlated with the inflation outbreak, we should have severe deflation in the next few months. Not “just” the 2% deflation we experienced during the financial crisis. No, severe deflation, because the money supply has been shrinking at a historic pace. As you can imagine, I am sceptical, to say the least.
Why did the money supply grow so fast?
The money supply – represented in this analysis by the broad money supply, i.e. M2 – measures the amount of money in the economy. But what is money? Money is funds that are readily available to pay for stuff. This means banknotes and coins, though they only make up a small part of the money supply. The larger part is the money you (and businesses) have in your bank account that is readily available, such as checking balances, savings deposits, etc. To understand what happened to the money supply, we need to understand what happened to deposits.
This FEDS note (link) explains this. The authors attribute the sharp and sudden increase in deposits in 2020 and 2021 to four factors:
- At the beginning of the pandemic, companies drew down their credit lines and hoarded money in their deposit accounts, probably out of fear of not having enough liquid funds in view of the extraordinary uncertainty in the initial phase of the pandemic.
- The Fed launched enormous asset purchase programs. When the Fed buys assets from a non-bank entity, new deposits are created. Similarly, when private banks buy securities from non-bank entities, deposits are also created.
- The savings rate of households and companies skyrocketed during the pandemic (link). Due to the great uncertainty at the time of the pandemic, households and companies kept these savings in deposit accounts, instead of investing them in other financial assets such as stocks and bonds.
- The US government paid out extensive stimulus packages to households. When a household receives a stimulus cheque, the proceeds are transferred to its savings account. The government also made loans to small businesses. Fearing the unknown, small businesses took out these loans and kept the proceeds in their deposit accounts.
All in all, (i) precautionary savings of both households and firms in the face of great uncertainty and (ii) very expansionary policies (fiscal and monetary) led to an unprecedented increase in deposits that catapulted the money supply into the stratosphere.
Co-authors and I find that people do use deposits for precautionary saving (link). That is, it seems plausible that deposits were hoarded when times were very uncertain.
We are back where we have been before: Expansionary policies (link) and high precautionary savings (link) caused demand to increase as the pandemic receded. This led to an outbreak of inflation. This also led to an increase in the money supply. But in my opinion, the reason for the outbreak of inflation was not so much the increase in the money supply, but what fundamentally caused the increase in the money supply (expansionary policies and precautionary savings).
Conclusion
The arguments in favour of the monetary theory of the price level are strong during this inflation flareup: Strong growth in the money supply preceded the outburst of inflation.
Outside of this inflation episode, however, there is basically no connection between growth in the money supply and subsequent inflation. Moreover, money supply growth has been historically low recently, but inflation has not. It seems that the high correlation between money growth and subsequent inflation during this inflationary flareup was a one-off event and not something we usually see. This note (link) similarly concludes that money growth contributed to predicting inflation this time, but not at other times. Can we completely discard the money supply story? I dare not – the correlation is simply too striking during this episode. Also, former central bankers criticize current central bankers for not having paid enough attention to money supply growth (link). Still, I doubt it is the main explanation.