
Historically, either stock markets or real estate markets have been frothy during periods of market exuberance. Today, according to usual metrics, both stock markets and real estate markets trade at historically elevated levels. I admit I am getting nervous. True, there are comforting factors. Most importantly, credit growth is low. Second, it is always difficult to predict when markets turn sour. I discuss arguments for and against looming real estate and stock market turbulence. I conclude that monetary policy fuels bubble-like behavior in asset prices, and that Quantitative Easing (QE) should stop. But what will happen then?
During famous periods of frothy asset markets, such as the late 1920s, the late 1990s, and the mid-2000s, either stock markets (the late 1920s and late 1990s) or housing markets (the mid-2000s) appeared overvalued. Today, both stock and housing markets appear overheated.
Why are housing and stock markets trading at such heights? Structurally determined low interest rates play an important role, but so does very expansionary monetary policy. To stop excessive risk taking and the creation of financial bubbles, monetary policy should be normalized. But what will happen then? Will markets tumble?
House prices
If we want to examine whether asset prices, including real estate prices, appear overvalued, we must relate them to something. In many countries, real estate prices have been soaring during the pandemic, but this is not in itself an indicator of an overvalued housing market. If other prices in the economy are rising, then it is only natural that house prices also increase. Similarly, if rental prices rise, house prices should also rise. And so on.
An often-used metric is the house-price rental ratio. It relates house prices to rents. It is used among practitioners and newspapers as a measure of the fair value of property (e.g., the Economist, link) and is also watched by central bankers (link).
OECD defines the price-to-rent ratio: “The price to rent ratio is the nominal house price index divided by the housing rent price index and can be considered as a measure of the profitability of house ownership.” Owners of real estate save these rental costs if instead buying and occupying a house. If rents increase, people should be willing to pay more for houses, pushing up real estate prices. These effects cause mean-reversion in price-to-rents ratios. Consequently, if house prices rise significantly relative to rents, homeowners are likely to be overpaying for their house.
Figure 1 shows the development in the price-to-rent ratio across OECD countries since 1970. OECD is normalizing price-to-rent ratios to 100 in 2015. Figure 1 reveals that global price-to-rent ratios are at historically elevated levels.

Source: OCED Database
Today, the OECD area house price-to-rent ratio is 22% above its 2015 value.
The historical average of the price-to-rent ratio is 92. Today, house prices across OECD countries trade at a 32% premium relative to this historical average. Real estate appears expensive.
It is important to notice that the price-to-rent ratio peaked just before the global financial crisis of 2008. In other words, the price-to-rent ratio “predicted”, or perhaps rather indicated, the global financial crisis of 2008. Today, global real estate markets appear even more “expensive”. In fact, today’s price-to-rent ratio is 11% above its peak right before the burst of the housing bubble that preceded the global financial crisis.
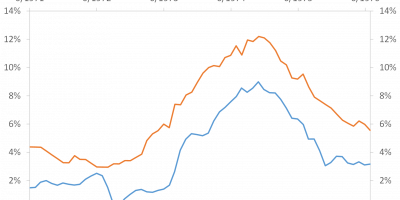
To get a feeling for how different countries perform, Figure 2 shows price-to-rent ratios for a couple of selected countries, and for 17 Euro area countries as a whole.

Source: OCED Database
In the US and my own small country, Denmark, house prices trade at more or less the same level relative to rents as right before the global financial crises. In the Euro area and the UK, valuations of real estate are even more extreme than before the 2008 crash.
It is noteworthy that house prices relative to rents have increased dramatically during the pandemic. House price-to-rents ratios have been increasing for some years now, since 2012, but the acceleration during the pandemic is alarming. It is not least on this background that I write this analysis. Something happened during the pandemic that have increased the risk of a house price reversal.
Stock prices
Housing markets appear frothy. This should raise eyebrows in itself. But this is not all. Stock prices have also soared. This is particularly true for the US stock market, the world’s largest and leading stock market.
We again have to scale stock prices by something to evaluate whether stock prices appear “overvalued”. I will show two metrics that both indicate historically high stock prices.
Figure 3 shows the market value of all corporate equity in the US scaled by US GDP, i.e. scaled by total US economic output. I label this the “price-output ratio”. I have investigated this ratio thoroughly in academic research (link). I find that it predicts stock markets. When stock prices are high relative to economic output, stock returns are subsequently low. It is also called the “Buffet Indicator” (link), as legendary investor Warren Buffet has previously used it to argue that the US stock market looks expensive.

Source: Fed St. Louis Database
Using the price-output ratio, the US stock market appears very “expensive”. The market value of corporate equity has soared to two times the value of total economic output in the US (200% of US GDP). According to this measure, US stocks trade at an all-time high. There is reason to pay attention.
Figure 3 contains two additional points. First, the US stock market also soared in relation to economic output right before the 2000 dot-com crash. I.e., this indicator “predicted” the stock market crash at the turn of the millennium. Second, stock prices have been increasing relative to economic output since they bottomed out after the global financial crisis, but the development has been spectacular during the pandemic. Like the housing market, something happened during the pandemic, causing stock and real estate markets to reach extreme valuation levels.
You may argue that the surge in the price-output ratio during the pandemic is due to the enormous drop in economic activity during 2020 (link). To calculate the price-output ratio, I divide stock prices by economic output. When GDP drops, the price-output ratio increases. Given that the drop in economic activity during the pandemic was due to a lockdown, the price-output ratio might paint a too negative outlook for stocks.
Let’s look at another well-known stock-market indicator, then. Alas, it also indicates a stock market that trades at a very high valuation.
The specific alternative indicator I talk about here is the CAPE (Cyclically Adjusted Price Earnings ratio) of Robert Shiller. It takes current stock prices and scales them by the average of earnings during the past decade. Given that CAPE divides stock prices by a long-run average of earnings, it is less sensitive to short-run fluctuations in earnings. It is in Figure 4.

Source: Robert Shiller’s online database.
Similar to the price-output ratio, CAPE also indicates that the US stock market trades at a very high level. Today, you have to pay more than USD 40 to buy one dollar of earnings. The historical price-earnings ratio is 18, as indicated by a dotted line in Figure 4. Relative to this historical average, the US stock market currently trades at a 100% premium. It also trades at a higher level than right before the stock market crash that caused the Great Depression of the early 1930s. Only right before the burst of the dot-com bubble at the turn of the millennium did US stocks trade at a higher level. It is somewhat scary how we are approaching that peak.
Pausing
Let’s pause. Overvalued housing markets have caused turmoil earlier in history. Overvalued stock markets have also caused turmoil earlier in history. Today, both the stock and the real estate market trade at, or close to, levels never seen before. I think we need to reflect on this.
Defensive remark 1
The surge in house and stock prices is largely driven by low interest rates. Asset prices, including house prices, are given by discounted cash flows. When interest rates are low, discount rates will be low, all else equal, and asset prices will be high. There is little doubt that low interest rates contribute to high asset prices.
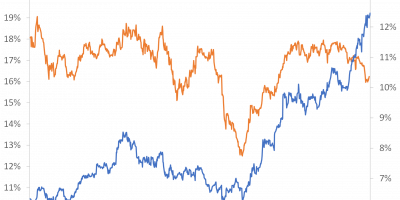
Interest rates are low for a number of structural reasons. At a conference I recently organized (link), we discussed why interest rates have been falling since the early 1980s. This includes demographic developments, changes in risk aversion, safe asset shortages, etc. These developments have driven down natural real rates of interest (or “r-stars” as central bankers like to call them). The natural rate is “the real short-term interest rate expected to prevail when an economy is at full strength and inflation is stable”. Figure 5 shows developments in estimates of natural rates in the US and the Eurozone.

Data source: New York Fed
Natural rates have fallen from something like 4%-5% during the 1960s to around zero percent today. When interest rates are low, asset prices will be high, all else equal. And when interest rates are low partly because of persistent structural factors (demographics etc.), high asset prices are also partly driven by structural factors.
If interest rates stay low for long – as seemed to be the consensus at the above-mentioned conference – high valuations of stock and housing markets are perhaps here to stay. In this light, some might argue, today’s valuation levels might not be “excessive”.
Counter argument 1
While I certainly share the belief that low natural interest rates have contributed to high valuations, and that low rates are here to stay, meaning we should get used to higher valuations, I do not agree that this explains everything. In particularly, I do not agree that today’s high asset prices are entirely due to structural factors. I believe today’s very expansionary monetary policies add to the effect of low natural rates. Expansionary monetary policy adds fuel to the fire, so to say.
As many of you know, I chaired the committee investigating the causes and consequences of the financial crisis in Denmark (link). One of the things we pointed out in the report was that monetary policy in the US was too expansionary before the financial crisis, fueling the house-price boom in the mid-2000s. We used the Taylor rule to illustrate. The Taylor rule is a monetary policy rule evented by Stanford Professor John B. Taylor in 1993. The Taylor rule can be used to judge whether current monetary policy is “too expansionary” given current levels of inflation and economic activity.
In Figure 6, I show a plot of the difference between the current Fed Funds Rate (the current level of the US monetary policy rate) and the Fed Funds Rate implied by a Taylor rule.

Source: Atlanta Fed
The actual Fed Funds Rate is zero percent today. Given current levels of inflation and economic activity, the Taylor rule prescribes that the Fed Funds Rate should be around four percent. In other words, monetary policy is too loose according to the Taylor rule. Today, according to the Taylor rule, the actual Fed Funds Rate is four percentage points too low, as Figure 6 indicates.
The Fed Funds Rate was also too loose before the financial crisis, Figure 6 shows. During the mid-2000s, the actual Fed Funds Rate was two-three percentage points too low, relative to the Taylor rule. In the report on the financial crisis, we are careful not to criticize the Fed too much for their conduct of monetary policy during the mid-2000s. We explain that the data back then did not support an increase in the policy rate. In more detail, Figure 6 is based on revised data available today, whereas policymakers must act in real time, using the data they have available in real time. In the mid-2000s, the available data did not indicate that monetary policy was too loose, as Bernanke (2010) (link) and we argue in our report on the financial crisis. Using revised data, on the other hand, we can today see that monetary policy was too loose before the financial crisis of 2008, contributing to the house-price boom of the mid-2000s.
One should take care not to interpret a simple rule, such as the Taylor rule, too literally. I, for instance, do not believe that interest rates should be increased by four percentage points immediately, as the rule indicates. But I do agree on the overall implication of the Taylor rule, that monetary policy is very loose currently, fueling bubble-like behavior on financial markets. Not only are policy rates too low given a Taylor rule, central banks are also buying bonds and other financial assets to the tune of many, many billions of dollars and euros per months. There is in my opinion no doubt that this pushes up asset prices relative to the effect of low natural rates. The implication is that Quantitative Easing should be stopped, in my opinion, as financial risks accumulate.
Defensive argument 2
I argue that financial risks are accumulating, and asset prices are reaching levels that should make us nervous. I also argue that there is reason to be attentive as both stock and real estate markets look frothy.
Does this mean that financial-crises probabilities are rising? A smart Ph.D. student at my department, Jakob B.A. Sørensen (who, by the way, is on the job market this year; link) has – together with other smart people from Harvard, such as Samuel Hanson, Robin Greenwood, and Andrei Shleifer – this interesting recent paper that argues that you can predict financial crises (link). They argue that real estate prices on their own have some, but low, predictive power for financial crises. Similarly, stock prices on their own have some, but low, predictive power for future financial crises. In other words, if “only” house prices or “only” stock prices rise, the risk of a financial crisis is a little, but not a lot, higher. In contrast, the authors argue and show empirically, the risk of financial crises rises substantially when house prices soar at the same time as households borrow a lot (when household credit is rising). Similarly, when stock prices soar and business credit soar at the same time, the risk of financial crises is also high. Basically, you need growth in both asset prices and credit before a financial crisis looms.
Today, there is not a lot of credit growth out there, whether we talk about loans to households or businesses. One of the factors usually predicting financial crises is not flashing red. This should give us some comfort.
Counter argument 2
I agree we should be thankful that credit is not expanding rapidly these days. I am unfortunately not sure we can feel entirely safe. The thing is that we have soaring house prices and soaring stock prices. Jakob and coauthors look at each market in isolation, i.e. look at high house prices together with growth in household credit or they look at high stock prices together with growth in business credit. What I am saying here is that we today have a combination of high house prices and high stock prices.
Jakob and coauthors do not investigate the situation we face today, that is high stock prices and high house prices but no growth in credit, because it is such an unusual situation. They do investigate, though, situations with high growth in everything, i.e. high growth in stock prices, house prices, household credit, and business credit, and this predicts crises amazingly well, but also occurs very seldom, i.e. this sample is small.
So, while I agree that the situation would have been considerably more frightening if we in addition to high stock and house prices had also had high growth in credit, I am not sure that we can lean back and relax.
Defensive remark 3
I have argued that stocks and real estate trade at elevated valuations and that we need to pay attention. The final defensive remark here is that valuation ratios are good at predicting long-term trends, but they are not good at predicting the timing of the turn of events. In other words, a high valuation of the stock market is a good predictor of low future long-run stock returns, but whether stock markets will start falling tomorrow, next year, or in two years, it does not predict well. There is no absolute valuation-threshold beyond which markets crash. That’s why predicting the timing of a burst of a bubble is so difficult.
As an example, during the dot-com bubble of the late 1990s, people already in 1997 and 1998 said stocks looked expensive. Other people then said: “But you also said last year that stocks look expensive, but stocks have just continued rising”. And they did. Until 2000. Then stocks crashed by 50%. So, perhaps nothing happens for some time, and people will be saying that everything is fine and there is no reason to worry. This might be true, but it might also be that the can has been kicked down the road, making the eventual adjustment all the more painful.
I have no counter argument here. Valuation ratios are not good at predicting the timing of events. They are, however, rather good predictors of the eventual effects. Given high valuations of both real estate and stock markets today, this predicts falling stock and house prices.
Conclusion
I argue that both stock and real estate markets look frothy. This is unusual and somewhat worrying.
The reason why stock and housing markets look overheated is not least that interest rates are very low. Low interest rates drive asset markets, including stock and real estate markets.
Structural factors have driven down interest rates, but interest rates are also low because of Quantitative Easing and other expansionary monetary policies. In my opinion, the risks that follow these expansionary policies appear too substantial to ignore.
The trouble is that central banks face a dilemma. Their policies have contributed to soaring asset prices, and it cannot continue. But if expansionary policies have contributed to soaring asset prices, there is a real danger that policy normalizations will lead to asset-price reversals.
There is one important comforting factor in all this. The fact that credit growth is low and banks appear well-capitalized means that the banking sector will potentially do reasonably well, even if stock and real estate markets should tumble. This means we should avoid a 2008-like event.
Tumbling stock and real estate markets can have negative macroeconomic effects on their own, though, via wealth channels and other channels. Following the pandemic, this is not what we need. Perhaps we avoid very negative outcomes, but there is still reason to be alert.
Postscript: Given the importance for the wider public of the message here, I contacted a Danish business daily. The story covering my analysis landed on the front page Friday (warning: scary picture) with a great feature article inside:
It was subsequently covered by other major Danish newspapers. I also did some TV-interviews.