Inflation expectations matter for monetary policy. If people and firms expect high inflation to persist, people will demand higher wages and firms will raise prices, making it increasingly difficult to combat inflation. But how to measure expected inflation? I discuss expected inflation in the euro zone. The common message across different measures is that expected inflation has increased, and now exceeds ECB’s two percent target, but is not “way off”. The situation is fragile, and ECB cannot let the guard down.
It is common practice to use inflation-linked swap rates, or breakeven inflation rates (link), as measures of expected inflation. Swaps are traded products, as are the bonds used to calculate breakeven inflation rates, i.e. we can follow their movements continuously. And, exactly because they are traded, swaps represent the average opinion of all the investors out there trading these things.
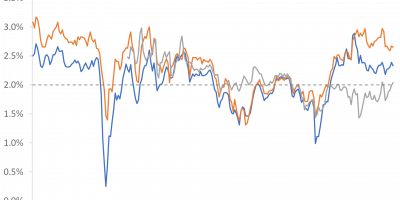
Figure 1 shows movements in 5y5y and 2y2y inflation-linked swap rates for the euro area. Assuming inflation swap rates measure expected inflation, something I discuss below, expected inflation over the next two years two years from now (2y2y), and over the next five years five years from now (5y5y), has increased steadily since the outbreak of the pandemic in March 2020, reaching more than 2.5% in April this year.

Data source: Datastream via Refinitiv.
Since early May expected inflation has fallen a little. At the time of writing, it is hovering around 2% plus. While there was a risk in March and April that expected inflation would accelerate, it seems as this has been contained. This is good news.
But do inflation-linked swap rates measure expected inflation at all?
Inflation swap rates as measures of expected inflation
Investors buying inflation protection want to hedge the expected rate of inflation but they also are aware that future realized inflation rates might differ from what was expected ex ante. If investors are risk averse – which they typically are – they will require to be compensated for the risk that future realized inflation rates differ from expected. We call this compensation “the inflation risk premium”. Inflation swap rates thus measure the sum of expected inflation and the inflation risk premium. This implies that if a risk premium exists, inflation swap rates will be biased measures of expected inflation.
Using the swap rate as an estimate of the expected rate of inflation thus implicitly means that one assumes the inflation risk premium is zero.
The econ 1.0.1. textbook model that specifies the nominal bond yield as the sum of a real interest yield and expected inflation is an example where one assumes that the inflation risk premium is zero:
Nominal yield
=
Real yield + expected inflation
Such a model could be right if either (i) investors are risk neutral, and thus do not require compensation for bearing inflation risk, or (ii) realized inflation might turn out to differ from expected inflation, but such inflation surprises are random and thus cancel out over time.
If, on the other hand, investors are risk averse or inflation surprises are not random, the model for nominal yields is:
Nominal yield
=
Real yield + expected inflation + risk premium
The swap rate captures the latter two components.
The swap rate might also reflect an illiquidity premium, but this is typically small/negligible in inflation swaps (link). The fact that the illiquidity premium embedded in inflation swaps is relatively small is by the way an additional advantage of using swap rates compared to breakeven inflation rates that are backed out as the difference between nominal yields and yields on inflation-protected bonds, such as TIPS (see again here).
Now the problem is that we cannot observe the inflation risk premium. We can only see the swap rate. This means that we need to estimate the risk premium. And this is where the real problems start.
Empirical literature typically specifies some process for expected inflation and then backs out the inflation risk premium as the difference between the observable swap rate and this estimated expected inflation. This is no straightforward estimation. First, there are many models out there that researchers can use to estimate the process for expected inflation. Second, uncertainty surrounds the estimates of each of these models.
Regarding the use of different models to estimate inflation risk premiums, it is fair to argue that surprisingly large differences arise. This paper (link) compares different empirical models for the U.S. and the euro area. Its Figures 9 and 10 reveal large differences between estimates of inflation risk premiums, in particular during volatile periods. For instance, for the U.S., some models generate a positive risk premium of 1.5% while others generate a negative risk premium of -2%. With such large differences, it is advisable to be humble if using estimated risk premiums to back out expected inflation rates from swap rates.
Furthermore, the estimate of the inflation risk premium from any single model is surrounded by uncertainty. As an example Figure 5 in one of the key papers on estimating inflation risk premium (link) finds that the inflation risk premium in the U.S. over the 1955-2005 period is around 1% on average, but the 95% confidence interval typically goes from 0% to 2%.
Finally, the process for expected inflation is often assumed to be persistent. This is fine in normal times, but in times of large changes in actual – not modelled – expected inflation, such models will underestimate movements in expected inflation. This means that if swap rates move a lot because actual (unobservable) expected inflation has in fact moved a lot, the empirically estimate of expected inflation will not move as much, because it is assumed that expected inflation behaves in a smooth fashion. The empirical model will say that the risk premium has moved a lot even when it is in fact expected inflation that has moved.
The ECB’s preferred model generates a smooth measure of expected long-term inflation while short-term expected inflation is more volatile, see Chart B here (link). I wonder whether it underestimates the actual movements in – unobserved – expected inflation at the moment when inflation itself moves dramatically.
Taken together there is model uncertainty, i.e. uncertainty about the right model to use, and estimation uncertainty, i.e. uncertainty about the precision of the estimate of each single model. These uncertainties imply that many view movements in inflation swap rates as indicating movements in expected inflation, even when it is by no means a perfect measure. At the moment these swap rates, under the assumption of no risk premiums, indicate somewhat, but not dramatically, elevated inflation expectations.
Survey measures of expected inflation
Swap rates tell us something about expected inflation, but they are not clean measures as they might also contain a risk premium. What about, as an alternative, simply ask people what they expect.
The advantage of such an approach is that such surveys exactly gives us peoples’ expectations. The drawback is that surveys are not available in real time. We need to ask people and collect data. Surveys are lagged indicators of expectations.
Household surveys
ECB has recently launched a Consumer Expectations Survey (link). It is still in its pilot phase, and covers “only” six euro area countries. It is not even available to the wider public. I asked ECB and they told me that:
“The CES is currently in its development phase and the data are currently not available outside the ESCB.” But also that “preparations are underway to regularly publish the aggregate results very soon and in the course of 2022 the underlying microdata.”
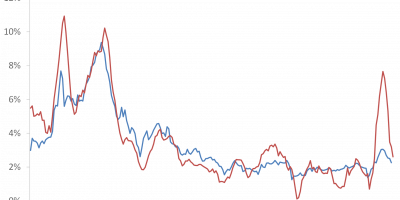
So, those of us not working in central banks have to wait. ECB, however, uses it in its speeches and so on, i.e. we have some information on what households expect. ECB’ chief economist mentioned in a recent speech (link) that households have increased their inflation expectations significantly. Figure 2 shows households’ expected inflation three year ahead.
The left-hand graph of Figure 5 reveals a significant jump from February to March in expected inflation three-years ahead. The median (average) euro area household increased its expected rate of inflation three years from now from 2% (4%) to 3% (5%). This is a very significant jump in expected inflation. The right-hand side chart in Figure 2 shows that more than four out of ten households expect inflation to exceed 4% in three years. Even when these expectations fell a little in April, it is a worrying sign that households fear high inflation rates will persist.

Data source: ECB speech.
Households’ expected rate of inflation influences the wage increases households demand. If I expect prices to increase by 4%, I want my salary to go up by 4%, at least. A wage-price spiral is the nightmare of all central bankers. Household expectations are important. At the same time, it is a well-established fact in research that many households systematically expect higher inflation than what is subsequently realised (link). Not all households have biased expectations. Well-educated and well-informed households tend to form more “correct” expectations. This is why it is advisable to pay more attention to the median household than the average household. Somewhat worrying, the median household also increased its expected inflation (Figure 2).
Surveys of professional forecasters
Given the biases in the expectation of many households, it might be useful to ask people who work professionally with these things. This is what you do in surveys of professional forecasters.
The ECB collects forecasts from professional forecasters once a quarter. ECB for instance asks what these professionals what they expect inflation to be this calendar year, the next, and the one following the next. The developments are in Figure 3.

Data source: ECB webpage.
Professional forecasters have increased their short-term inflation expectations while their long-term expectations remain anchored.
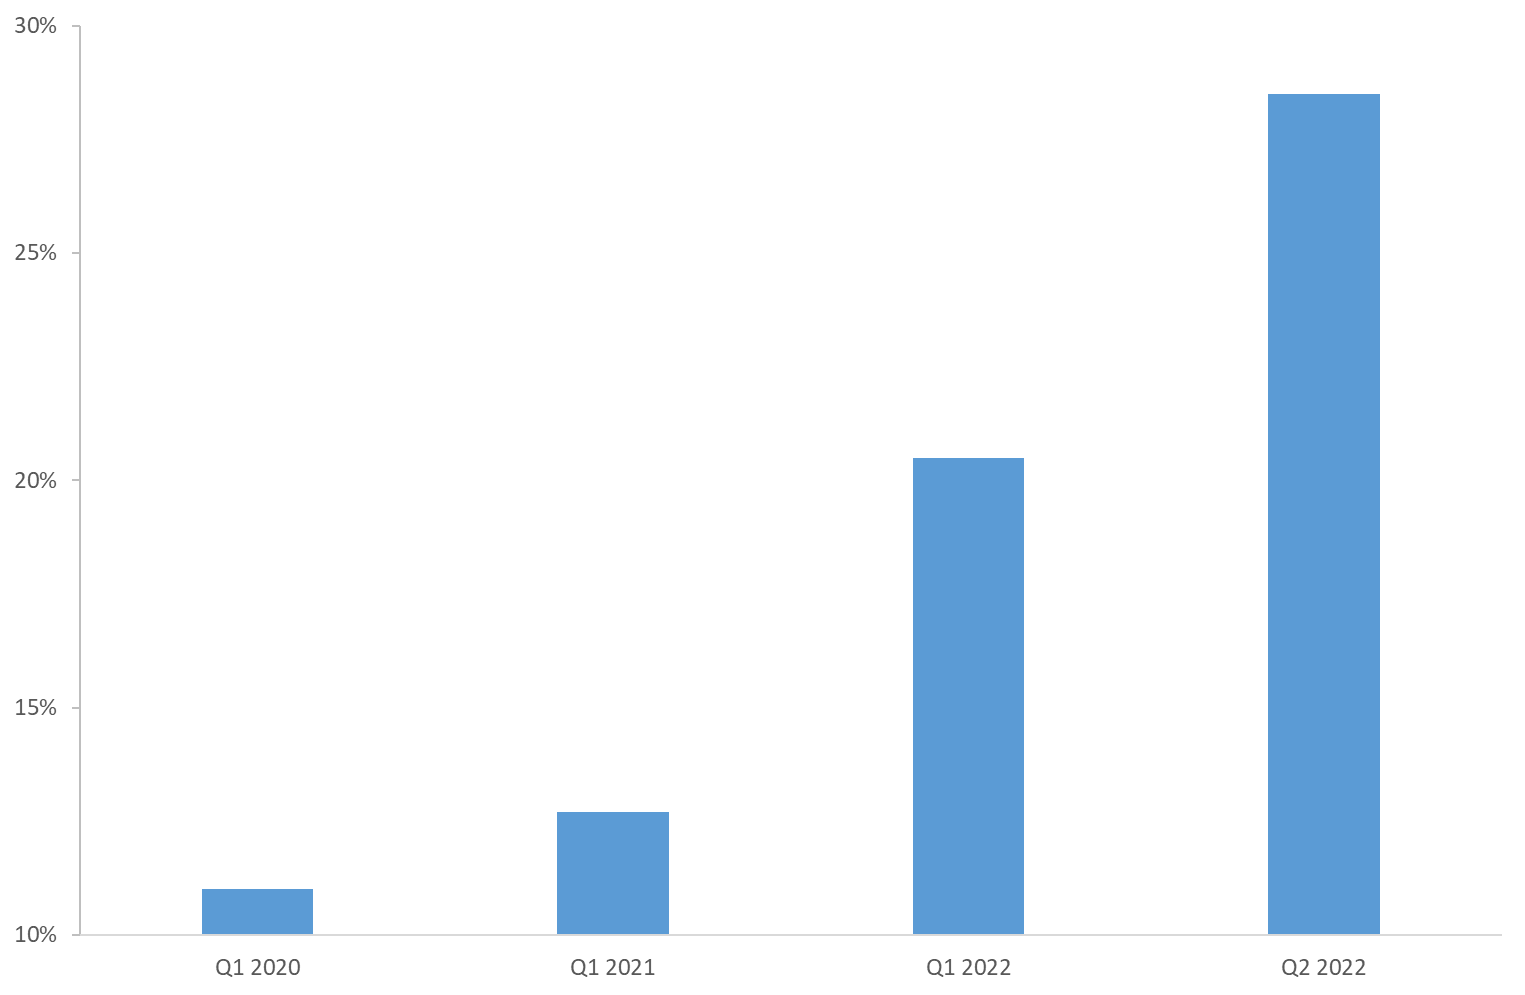
One worrying feature here, though, is that more and more forecasters expect a very high rate of long-run inflation, even when the mean has not moved much. Figure 4 shows the proportion of forecasters who expect euro area inflation to exceed 2.5% five years from now.
While only 10% of forecasters expected inflation five years from now to exceed 2.5% in Q1 2020, today almost a third of forecasters expect inflation to exceed 2.5% inflation five years from now. Similarly, today, 13% of forecasters expect inflation five years from today to exceed 3%, compared with only 4% of forecasters in Q1 2020.

Data source: ECB webpage.
This increase in the tail of the distribution is worrying because, as the ECB says itself, “the most important signal is conveyed by the shift in the distribution of beliefs about future inflation more than the precise level of expected inflation.” (link).
Conclusion
It is difficult to measure expected inflation. Inflation-linked swap rates are available in real time but they contain a risk premium that it difficult to estimate. Survey expectations need to be collected, which this takes time, meaning they are available with a lag only. Also, they are typically only available once per month or quarter, depending on the survey.
Common to different measures of expected inflation in the euro area, there is a clear tendency that they have increased recently. This is somewhat worrying. On the other hand, there is no reason to panic, I would say. Expected inflation is too high, but not by a very large margin. Given the fragility of this situation, though, ECB cannot let its guard down.