
The US stock market has grown much faster than the US economy since the early 1980s. The total value of US corporate equities is now 280% of US GDP, up from 50% in the early 1980s. A key reason for this is the decline in interest rates over the same period. While interest rates have risen since 2022, they still cannot fall as much in the future, and therefore cannot support stocks as much, as they have over the past forty years. Expect low future returns from stocks.
Seventy years ago, in the early 1950s, Americans could buy all corporate equities in the US if they pooled all their income over six months.
Today, Americans must pool their income over nearly three years if they want to buy all US corporate equities. The US stock market has become much more expensive, especially since 1980.
You can also put it this way: In the early 1950s, the value of all corporate equities in the US was $200 billion. GDP was $400 billion. As you know, GDP also measures total income, i.e. labour income as well as corporate profits, interest income, etc. So you would need about 50% of a year’s total income, about six months, to buy all corporate equities. Today, the total value of US corporate equities is $78 trillion (Q4 2023 figures were released this week), while GDP is $28 trillion. US corporate equities represent 280% of US GDP or nearly three years of income. How is it possible that the stock market has grown much faster than the US economy and what are the consequences?
Figure 1 shows how the value of US corporate equities as a percentage of US GDP has evolved since 1953.

Source: FRED of St. Louis Fed and J. Rangvid.
The total value of equities relative to GDP has moved steadily upwards since the early 1980s, albeit with some significant interruptions/fluctuations: During the dot.com bubble, stocks rose much faster than the economy, only to implode when the bubble burst in 2000. After the 2008 financial crisis, equities fell much faster than GDP, but recovered quickly. During the 2020 corona recession, economic activity fell dramatically, causing the ratio of equities to GDP to rise sharply, but quickly recovered, leading to a subsequent reversal in the valuation of US equities. But overall, the trend has been upwards for four decades.
Three important questions arise from these long-term developments:
- Is this – scaling stocks by GDP – the best way to measure the value of the stock market?
- Why has the stock market become so “expensive”?
- What does the current valuation mean for expected stock returns?
The expensive stock market
The title of this analysis is “the expensive stock market…”. “Expensive” is a loaded word. It means that we pay a lot for something. Stock markets are constantly rising, so does that mean they are constantly getting more expensive? Not necessarily.
When financial economists talk about a high valuation of the stock market, which you could also call an expensive stock market, we usually mean a stock market where the stock price today is high relative to some measure of an underlying fundamental value of the stock market.
But measuring this “underlying fundamental value” is inherently difficult. Theoretically, stock prices are determined by the discounted value of future cash flows, but how are we supposed to predict these future cash flows and what is the relevant discount factor? This can be debated at great length.
In 2001, legendary investor Warren Buffet argued that the value of all listed stocks in the US as a percentage of US GNP “is probably the best single measure of where valuations stand at any given moment” (link). Separately, I showed in academic research (link) that scaling the stock market by GDP contains more information about future stock market returns, both in the US and internationally, than other stock market valuation metrics such as the price-dividend ratio, where you scale the stock market by dividends, or the price-earnings ratio.
Longer data
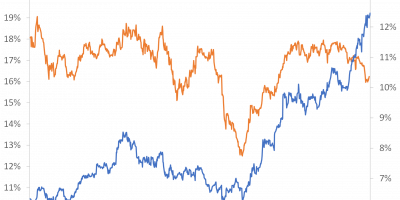
Data on the total value of all US corporate equities dates back to the early 1950s, as shown in Figure 1. If we want data going back even further, we must resort to other metrics. One such is Nobel Laureate Robert Shiller’s cyclically adjusted price-to-earnings ratio, which divides the current level of the S&P 500 by the average earnings per share over the last ten years. I show it in Figure 2.

Source: Robert Shiller’s webpage and J. Rangvid.
In January 2024, you had to pay USD 32 for one dollar of cyclically-adjusted earnings. While the price-earnings ratio was higher before the crash of 1929 (USD 32.5), before the crash of 2000 (USD 44) and during the coronavirus pandemic (USD 38), the valuation of the stock market is still very high today.
You can look at other indicators. They also say that the value of the stock market is high. My favourite – the stock market as a fraction of GDP (Figure 1) – says that, apart from the strange corona situation, the stock market has never been so expensive.
Why is the stock market so expensive?
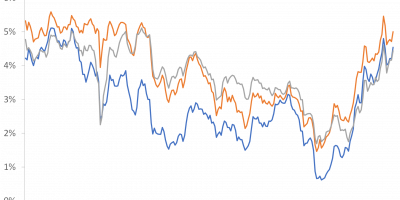
Figure 3 shows an interesting relationship. It shows the value of all corporate equities as a fraction of GDP, as in Figure 1, but now together with the yield on ten-year government bonds.

Source: FRED of St. Louis Fed and J. Rangvid.
There is a strong negative relationship between the value of the overall stock market and interest rates. When interest rates rise, as they did in the 1970s, the value of the stock market falls. Similarly, the long-term decline in interest rates since the early 1980s correlates with the rising value of the stock market. Furthermore, the sharp rise in interest rates in 2022 led to a sharp correction in the valuation of the stock market, emphasizing the negative correlation.
Low interest rates contribute to rising stock markets in various ways. They lower discount rates and thus increase the present value of future cash flows, they support future economic activity and thus increase the path of future cash flows, and they lower borrowing costs and thus the cost of capital for companies, which lowers interest expenses and raise profits, thus increasing stock prices.
Note that I am not discussing the difference between nominal and real interest rates here, as real interest rates have also fallen since the 1980s.
Last year, Fed economist Michael Smolyansky wrote an interesting paper (link) showing that the decline in interest rates over the past four decades is the main reason the stock market has performed so well. Lower interest rates have boosted earnings growth (due to lower interest payments, as mentioned above), and lower interest rates have lowered discount rates, which has increased the price-to-earnings ratio. Lower interest rates (and lower corporate taxes) can explain 40% of earnings growth over the past four decades, while lower interest rates explain almost all of the expansion in price-earnings ratios, Michael Smolyansky finds. Taken together, these effects account for much of the strong performance of equity markets since the 1980s.
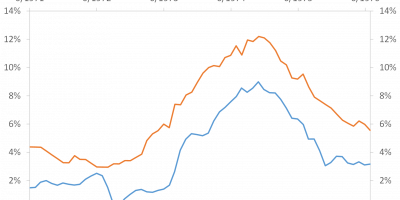
The Fed has kindly made the data used in Smolyansky’s analysis available on its homepage. In Figure 4, I show the yield on ten-year government bonds together with the share of interest and tax expenditures in the earnings of US companies. The figure illustrates how lower interest rates have (unsurprisingly) lowered the share of interest payments in corporate profits, thereby increasing profits and the valuation of the stock market, which in turn has caused the stock market to rise so remarkably.

Source: Fed Board (link) and J. Rangvid.
While lower interest rates, in my opinion, have been of first-order importance for the sustained rise in the stock market for four decades, additional explanations exist. For example, Greenwald, Lettau & Ludvigson (link) argue that a shift in the rewards to production from workers to capital owners has also contributed.
Implications for the future
While it is fun to be invested in the stock market when it is rising, it is less fun to enter the market when prices have already risen.
While falling interest rates have contributed to rising stock markets, the current level of interest rates suggests that the stock market cannot expect much help from this side in the future. OK, interest rates are higher today, in 2024, than they were in 2021, so things may not be as bad today as they were a few years ago, but in a long-term historical comparison, interest rates are still relatively low, as Figure 2 shows.
Figure 5 shows the inverse of the price-earnings ratio (from Figure 2), which is the earnings yield. The earnings yield is a frequently used estimator for the long-term real returns of the stock market.
At the time of writing, in early 2024, the earnings yield is low. This means that the return you can expect in the future is low too. In the longer term, for instance over the next ten years, expect the US equity market to deliver a real return of around two per cent per year.

Source: Robert Shiller’s webpage and J. Rangvid.
Conclusion
Today’s valuation of the US stock market is high. By my favorite measure, scaling the total value of stocks by GDP, the stock market is historically expensive, apart from the strange and short-lived corona experience in 2020.
One important reason why the value of the stock market has continued to rise since the early 1980s, and thus is so high today, is the persistent decline in interest rates over the same period.
From here, interest rates can no longer fall as sharply as they could over the past four decades. In addition, the high valuation of the equity market is putting pressure on expected returns. Looking ahead, expected returns from the US stock market are low.
Are we sure that equity returns will be this low? No, of course not. Things can happen. There is uncertainty around the point estimate.
If you use the measure of expected returns that I have proposed here, the last ten years have performed much better than expected. Ten years ago, in 2014, you would have expected an average annual real return of four per cent for the following decade, i.e. from 2014 to 2024. But in fact, real returns over the last ten years have been more than double that, averaging nine per cent a year. Things can turn out amazingly well.
On the other hand, the last time the price-earnings ratio was 32, as it is today, was in 1929 and 1997. From 1997 to 2007, stocks achieved an average real return of three per cent per year. In the 10-year period after 1929, the real return on equities was negative at minus two per cent. Per year, over ten years! The same valuation as today was followed by a decade in which equities generated negative returns (in real terms) year after year. So, yes, things can go well, and stocks can deliver more than we expect, but things can also go wrong. In my opinion, many things must come together for US returns to be high over the next decade.