The behavior of the stock market during this recession raises three main questions: (i) why did stock markets fall so spectacularly during February/March, (ii) why did stocks rebound so spectacularly during April/May, and (iii) why is the stock market currently at its pre-crisis level? My previous post (link) presented the stylized facts and addressed stories that cannot explain the facts. In this post, I provide some potential explanations.
I my previous post (link), I mentioned that the rebound in the stock market since its low in March cannot be explained by (i) revisions to the economic outlook – in fact, economic forecasts were revised down during spring, (ii) a preference for just a few (FAANG) stocks, as the rebound has been international and broad based, even when large-cap stocks have done particularly well, (iii) a hypothesis that this recession is not particularly bad – in fact, at least in the short run, this recession is much worse than the 2008 recession, or (iv) the fact that markets also recovered after 2008 – markets always recover, i.e. this is not an explanation.
What can explain it, then? First, a warning: I do not want to raise expectations too much (sorry). I will not be able to offer a full explanation of these puzzles in an app. 1,900 words blog post. Also, as you will see, puzzles remain, even if we can explain some things. Finally, I have not seen a good explanation of these puzzling stylized facts (though Gavyn Davies’ piece in the FT is a good place to continue after reading this post; link). Hence, it would not be serious nor academic if I claimed that I could explain everything. What I can do, though, is to provide some hints at what might be relevant parts of an explanation.
Explanations that contain elements of truth
Earnings suffered more in 2008
In the end, earnings and not economic activity (GDP) determine stock prices. In the long run, there is a strong relation between earnings and economic activity, which is why we focus on economic developments when we try to understand stock markets. The relation is not one-to-one, though, in particular in the short run. Hence, let us discuss earnings.
Earnings suffered dramatically in 2008. Often, we look at 12-month earnings, as quarterly earnings are volatile. 12-month reported earnings per share for the S&P500 came in at 6.86 in Q1 2009, which is app. 10% of 12-month reported earnings in Q1 2008. I.e., earnings fell by a mind-blowing 90% during the financial crisis of 2008.
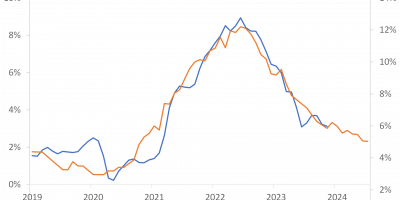
Earnings fell in Q1 2020, too, but much less: From USD 139 per share in Q4 2019 to USD 116 (12 month reported earnings), i.e. by 17%. At the time of writing, around 90% of companies in the S&P500 have reported earnings for Q2 2020. Earnings (12-month reported) seem to be coming in at close to USD 96 per share, which is a drop of 17%, too, compared with Q1. Earnings have thus dropped by 17% during each of two consecutive quarters. But, and this is the main thing, these drops pale in comparison with autumn 2008. In autumn 2008, earnings dropped by 68% from Q3 to Q4 and then again by 54% from Q4 2008 to Q1 2009. This figure shows the quarterly percentage changes in 12-month reported earnings of the S&P500 in 2008 versus 2020. “0” on the x-axis is Q2 2020, respectively Q4 2008. The drop in earnings was just so much larger in 2008.

Source: https://www.spglobal.com
“1” on the x-axis in the figure is thus Q1 2009 and Q3 2020, i.e. firms’ expected earnings in Q3 2020 (and actual earnings in Q1 2009). If these expectations hold true, earnings are expected to do relatively fine going forward.
Earnings do fall from Q1 to Q2 this year. Earnings surprises matter, too, though, i.e. whether actual earnings are higher (or lower) than expected. At the time of writing, around 80% of companies have reported positive earnings surprises for Q2. This, that actual Q2 2020 earnings are better than expected, helps explaining why stock prices rise currently.
If investors primarily look at earnings, this helps explaining why stock prices fell considerably more in 2008 than they have done during this recession and why the stock-market recovery took longer in 2008. Earnings have simply not suffered so much this time around. For that reason, stock prices have not suffered so much this time around either.
Monetary and fiscal policies have been aggressive
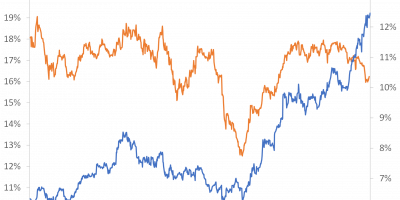
Another factor that helps explaining why stock prices today are at pre-crisis levels, in spite of the severity of the recession, is that policy interventions have been aggressive. Immediately, at the onset of the crisis, monetary policy turned very expansionary. This can be illustrated by the weekly changes in the Fed balance sheet, as in this graph:

Data source: Fed St. Louis Database
The figure plots the weekly changes in the Fed balance sheet due to purchases of financial assets, in millions of USD. The Fed balance sheet changes when the Fed buys/sells financial assets. During March this year, there were weeks when the Fed intervened to the tune of USD 600bn. This is an enormous amount of money. It is, by way of comparison, more than twice the weekly amounts spent during the financial crisis of 2008, the figure also shows.
At the same time, yields are very low. This forces investors to buy risky assets if they want some kind of return, supporting stocks.
In addition to very aggressive monetary policy, fiscal policy has also been very aggressive.
Why did stock prices fall during February/March?
OK, so earnings have not fallen as much as in 2008, earnings for Q2 2020 have surprised positively, monetary and fiscal policies have been very aggressive, central banks pump liquidity into the system, and interest rates are very low, implying that investors need to invest their money in risky assets if they want a positive expected return. These features help explaining why stock prices today are not much lower than in the beginning of the year. But, if this is the story, why did stock markets drop so dramatically in March?
Changes to expectations to earnings
Earnings have dropped in Q1 and Q2, even if considerably less than in 2008. Perhaps the stock-price drop in February/March was simply due to a downward revision in expected earnings. Alas, this is not the case. Landier & Thesmar (link) have an interesting analysis where they look at analysts’ expectations to the earnings of S&P500 companies during Q1 and Q2 2020. They find that analysts cut their expectations to earnings of S&P500 firms, but not so much that it can account for the drop in stock prices during February/March. In other words, the drop in stock prices in February/March cannot be explained by analysts reducing their earnings forecasts.
If the drop in expected earnings cannot account for the drop in stock prices in February/March, what happened then? Financial economists have a straightforward way of explaining this. Stock prices are discounted cash-flows. To understand stock price movements, we must understand cash-flow and discount rate movements. When the fall in expected earnings is not large enough to account for the drop in stock prices, discount rates must have increased in February/March. In other words, during February/March investors required a higher expected return if they should invest in stocks. This is also the conclusion in Landier & Thesmar and in Gormsen & Koijen (link). Basically, this is the conclusion in most empirical asset-pricing literature: stock prices move too much to be justified by movements in cash-flows. Discount rate variation is the reason, the literature concludes.
When stock prices move, and it cannot be because of cash-flow movements, it must be discount-rate movements. This is fine, but it is also somewhat tautological: If A = B + C, and A moves but B does not, then it must be because C moves. A more difficult question is what makes discount rates move in the first place? I.e., what is the deeper economic explanation? Perhaps/probably risk aversion spiked, when investors in February suddenly realized the severity of the virus. Perhaps/probably some market participants faced funding constraints. And so on. In other words, I agree that discount rates most likely spiked during March, but I am not 100% sure why and I do not know if the increase in risk aversion is large enough to account for the increase in discount rates, and thus account for the drop in stock prices.
Lingering doubts
So, a potential reason why stock markets have done better than in 2008 is that earnings have not suffered as much as in 2008 and central banks have flooded the market with liquidity (and yields are at zero). The reason why we saw a massive fall in stock prices in February/March, and an unprecedented rebound during April/May/June, then probably is that discount rates increased during the early phase of the crisis, and then stabilized. This is a story that somehow makes sense.
Two things are still strange (to me at least), though.
First, if stock prices are at their right levels now, why did they have to fall so much in March? OK, because risk aversion increased and funding conditions tightened. But, if risk aversion increased in February because investors understood that a recession was looming, why would investors turn less risk averse three weeks later, when economic forecasts just kept on deteriorating? Probably the Fed and the Treasury (via monetary policy and fiscal policy) eliminated the spike in risk aversion via aggressive policy interventions, but it is still not 100% clear how to reconcile these features of the data.
Second, the behavior of earnings has been surprising. During recessions, earnings normally contract much more than economic activity. So, when economic activity in 2020 contracts much more than in, as an example, 2008, a reasonable hypothesis is that earnings in 2020 would contract much more than in 2008. This has not happened.
To some extent, this graph summarizes both the explanation of the relatively mild response of the stock market to this recession and the remaining puzzle:

The figure shows how earnings dropped 68% from Q3 to Q4 2008 but seems to drop “only” 17% from Q1 to Q2 this year. This explains why the stock market has performed considerably better during this recession compared to its performance in 2008, for instance. On the other hand, the figure also shows that GDP dropped by 10% from Q1 to Q2 this year and “only” by 2% from Q3 to Q4 2008, i.e. the fall in economic activity is five times larger during this recession. It is puzzling that earnings drop so much less during this recession when economic activity contracts so much more.
So, the relatively modest contraction in earnings helps explaining the relatively fine performance of the stock market during this recession, but it is difficult to understand why earnings have behaved reasonably well. Perhaps this is because banks were suffering in 2008, but are able to help firms getting through this recession. Perhaps it is because firms have been able to adapt better this time. We do not really know. From an academic asset-pricing perspective, it is interesting that the stock market has behaved so differently this time around, compared to how it normally behaves. From an investor perspective, we can only hope that the stock market will keep on behaving in a different way than it usually does, as, otherwise, stock prices will fall going forward.
Conclusion
The facts that earnings have done better than in 2008 and that monetary policy has been very aggressive help us understand why the stock market has done well during this recession. Some puzzles still remain, though. For instance, why have earnings done so reasonably well, given the severity of the recession, and why did risk aversion increase so dramatically in February only to normalize few weeks later, in spite of the worsening recession. Perhaps the sensible answer is that this recession has been unusual in many dimensions, and some things will remain difficult to understand.