

UK yields have been extremely volatile during recent weeks. This results from irresponsible fiscal policy and subsequent policy interventions but also from low bond-market liquidity. Liquidity is low–not only in the UK–because of financial regulation, central bank balance-sheet reductions (Quantitative Tightening), and other reasons. Low liquidity means that financial shocks cause extraordinarily large movements in asset prices. I discuss consequences for bond and equity markets.
The recent turmoil in UK politics, pension funds, and bond markets is so spectacular that one does not know where to begin:
- A government proposes enormous unfinanced tax cuts.
- Markets go haywire.
- Pension funds are on the brink of bankruptcy.
- The central bank intervenes, thereby effectively bailing out pension funds.
- The finance minister is sacked after less than six weeks in office.
- The prime minister resigns. The new PM will be the third of this year.
And all this, by the way, in a G7 country, not an emerging-market country with a volatile history. It leaves one speechless.
I draw two lessons.
First, the events show there is a limit to how much even a G7 country can spend without upsetting financial markets. This is important because, until recently, many governments thought they could do whatever they wanted without paying attention to budget deficits. Interest rates were low, often negative, so why all the fuzz about balanced budgets and so on? Even world-famous economists argued that government debt would have “no fiscal cost” (link). The result was a ballooning of government debt around the world.
The UK events inform us that debt has cost. There is a limit to the size of deficits financial markets tolerate, not only in emerging markets, Italy, and Greece, but also in G7 countries. It is not necessarily bad if this leads to a renewed focus on sound fiscal policies.
The second lesson–which is the one I will focus on here–is that liquidity can dry up even in large bond markets, such as the UK gilt market. When liquidity is not sufficient, yields fluctuate wildly when the system is shocked.
To set the scene, Figure 1 shows daily movements in yields on 30-year UK government bonds since 1992. Recent moves have been unprecedented. Some days, yields increased by almost 50 basis points. Other days, they fell by more than 100 basis points, only to increase again. And so on.

Data source: Datastream via Refinitiv.
Why were markets so volatile? Fiscal policy was irresponsible and pension funds sold bonds, so yields should move. But why did they move so much? Why weren’t there enough buyers of the bonds pension funds sold? Yields were high, so they should have been attractive from an investment point of view. Or, as a recent article by Viral Acharya and Raghuram Rajan asks (link): “Where has all the liquidity gone?”
The concern about liquidity
Liquidity is the ability to trade securities without affecting their price. A liquid market is thus one where you can sell even large chunks of assets within a short period of time without affecting their price. Conversely, an illiquid market is one where prices move a lot when you try to sell or buy large amounts of assets.
In the UK turmoil, pension funds sold gilts, as I explained in my previous post (link). If the gilt market had been liquid enough, pension funds could have done so without affecting the price that much. Instead, intense selling pressure coupled with low liquidity caused bond prices to drop, and yields to rise.
People discuss two main explanations why liquidity is low: Regulation prevents banks from warehousing bonds, and central banks currently absorb liquidity as they shrink their balance sheets (Quantitative Tightening).
Regulation and liquidity
The interesting–paradoxical–thing is that there is reason to believe liquidity is low because of financial regulation, among other reasons. The story goes as follows. Banks have historically played an important market-making role in bond markets. If investors (such as pension funds) wished to sell large quantities of bonds, banks bought them. Banks–as we say–“warehoused” bonds, meaning banks kept bonds on their balance sheets until markets had settled down and demand for bonds returned.
If a bank should be able to act as such a liquidity-shock absorber, it requires that the bank is willing to keep the bonds on its books. Alas, this has become more difficult, more expensive, after the financial crisis because of leverage constraints.
Leverage constrains are constraints on the size of banks’ balance sheets, given banks’ capital levels. When subject to such constraints, banks can only warehouse so many bonds. The implication is that when investors–for instance pension funds–need to sell a lot of bonds, banks can no longer act as shock absorbers. Liquidity has evaporated, and prices have to move a lot to clear markets. The result is what we see in Figure 1, that is large movements in yields.
Do we have evidence? This paper (link) presents interesting results that liquidity in the gilt market has evaporated alongside the introduction of bank-capital requirements.
It is not only academics who worry. Even former Fed President and current US Treasury Secretary Janet Yellen is worried (link). This report (link) from the US Treasury to the Treasury Borrowing Advisory Committee (TBAC) explains why.
The report highlights how regulatory changes of the form I mention above have “reduced dealers’ intermediation capacity”, i.e. reduced big banks’ possibilities of acting as liquidity-shock absorbers. In Figure 2, I copy an important figure from the report. It shows how primary dealers (big banks) have withdrawn from the Treasury market. Before the financial crisis in 2008, transactions of primary dealers amounted to app. 14% of outstanding treasury debt. Today, it is around 2%. The reason, the report argues, is that financial regulation has reduced big banks’ intermediation capacity. Even in the world’s largest sovereign debt market, liquidity is low because of regulation, inter alia, meaning shocks to liquidity might lead to large movements in yields.

Data source: Copied from page 75 here.
Quantitative tightening
There are additional reasons why liquidity is low. The aforementioned article by Acharya & Rajan (link) argues that financial markets have become accustomed to central banks providing a lot of liquidity via Quantitative Easing (QE). During QE, central banks bought bonds from private markets, thereby providing liquidity. Now, because inflation is high, central banks have started to sell the bonds they hold on their balance sheets–popularly called Quantitative Tightening (QT). When central banks sell bonds to the private market, they withdraw liquidity from that market, thereby creating a more volatile and vulnerable market.
This can be seen from Figure 3 that shows the so-called MOVE index. The MOVE index measures expected volatility in the US Treasury market. It is similar in spirit to the more famous VIX index that measures expected volatility in the equity market. Figure 3 shows that expected US government bond market volatility is currently at levels not seen since the financial crisis.

Data source: Datastream via Refinitiv.
Corporate bond markets
The paper I mentioned above (link) on gilt-market liquidity and regulation emphasizes that it cannot prove causality. I.e., the paper observes that sovereign bond-market liquidity deteriorated as banking regulation was tightened after the financial crisis, but cannot prove that regulation caused lower liquidity. The same goes for the report to the TBAC also mentioned above. There is a smoking gun, but no bullet-proof evidence.
We get that evidence from other bond markets, though, for instance from corporate bond markets.
When commercial banks buy risky assets, such as corporate bonds, they must hold more capital. These capital requirements have increased significantly since the financial crisis. This has made it more expensive for banks to act as liquidity-shock absorbers.
I asked a good colleague and expert on these issues–Jens Dick-Nielsen (link)–for some good graphs I can show you. First, he pointed out that there are a number of papers that document how liquidity in the corporate bond market has suffered because of banking regulation introduced after the financial crisis, including his own research (link, link, link). Second, he pointed to a new paper (link) that has this graph that I copy as Figure 4:

Data source: Copied from Figure 2 here.
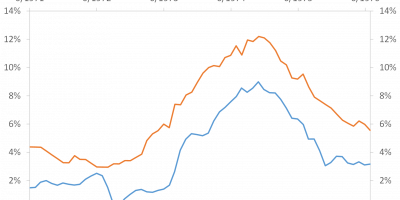
Figure 4 shows how bank-capital regulation, introduced in 2012 (indicated by the vertical line in Figure 4), that made it more expensive for banks to act as liquidity-shock absorbers, led to lower liquidity, and hence a higher liquidity premium, for bonds against which banks must hold more capital (Speculative Grade bonds).
Covered bond markets
The final example from the bond market is from my own small country, Denmark. Because of the way Danes finance house purchases, via mortgage-backed bonds issued by mortgage-banks, Denmark has the world’s largest covered bond market(!) (see Table 9 here: link), bonds are AAA-rated, and they are well-known for their high liquidity. For instance, Danish mortgage-backed bonds upheld their liquidity during the financial crisis of 2008 while other markets dried up (link).
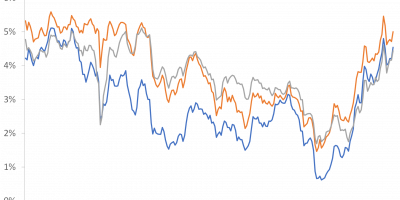
Due to recent global movements in rates, some foreign buyers (Japanese investors) have been selling Danish mortgage bonds. The spread between yields on long Danish government bonds and mortgage bonds has widened, as I show in Figure 5. There are probably multiple explanations, but one is that banks are no longer able to act as liquidity-shock absorbers because regulation has made this more difficult/expensive, as described above.

Data source: Datastream via Refinitiv.
Liquidity and the stock market
Central banks’ withdrawal of liquidity via Quantitative Tightening has effects beyond bond markets. Figure 6 is an updated version of a figure I have showed you earlier. It shows the combined value of the assets held by the European Central Bank (ECB) and the Fed, measured in US dollar, against the S&P 500. This updated version of the figure includes QT. I use the figure to illustrate the consequences of QE and QT for the stock market.

Data source: FRED of St. Louis Fed and Thomson Datastream via Refinitiv.
As a response to the Covid-crisis in March 2020, central banks bought assets for literally thousands of billions of USD. The stock market immediately jumped, Figure 6 shows. The cool thing to notice from Figure 6 is what happened as central banks started tightening monetary policy and reduce their balance sheets in early 2022. Stock markets immediately suffered. This is evidence that stock markets have been driven by the liquidity injected by central banks during recent years. Now that liquidity disappears, the stock market falls.
Conclusion
Since the financial crisis, banks have become better capitalized. This is good. The banking system is more resilient. One price we have paid, though, is that the bond market has become less resilient because banks cannot warehouse bonds as well as previously.
This creates a paradox. Financial regulation has made banks safer by preventing them from taking on market risk when they act as shock absorbers in the bond market. Risks on banks’ balance sheet have been reduced. But risks have not disappeared. They have moved to the bond market. The consequence is that we will see more bond-market volatility when shocks hit the system, as during the UK LDI crisis.
In addition, central banks injected enormous amounts of liquidity during QE. Now they are withdrawing that same liquidity. This affects bond-market liquidity but also stock markets. Stocks jumped as central banks restarted QE in 2020. Stocks now suffer because central banks withdraw liquidity.
In bond markets, when rates go up because there is not enough liquidity, borrowers pay more. These borrowers can be governments that then have to raise more taxes. They can also be households who borrow to finance house purchases, and thus have to pay more on their mortgages. For these reasons, low liquidity is not only a concern for financial-market participants. It is a broader concern because it has real consequences for real people.