
Why is inflation so high? How much of it is due to demand and how much to supply? And how much is temporary and how much persistent? These are arguably some of the most important economic questions these days. In this analysis, I present my views. I argue there are four main reasons why inflation is high, some of them transitory but others not, meaning it will be costly and take time to bring inflation back to target.
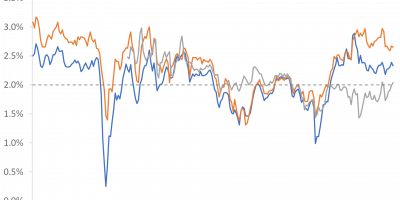
Inflation is incredibly high in many countries. Figure 1 shows inflation (annual percentage increase in consumer prices) in the OECD area, the euro area, and the U.S. since 1970 (euro area data start in 1999, when the euro was launched).

Data source: OECD.
Figure 1 reveals that:
- Inflation hovers around its highest level in four decades.
- The rise in inflation has been amazingly fast. At the start of 2021, inflation was below 2% across OECD countries. One and a half year later, today, it is close to 10%.
- The rise in inflation is similar across countries, implying that global, not country-specific, factors are at play.
Why do we see this very high rate of inflation in so many countries at the same time?
Four reasons
I believe there are four main reasons:
- Leaving the pandemic, demand soared.
- Demand was stimulated by too expansionary monetary and fiscal policies.
- Demand shifted, from services to goods. At the same time supply chains were disrupted.
- Commodity prices rose.
In the rest of this analysis, I elaborate on these points. But before doing so, let me rule out one often-heard explanation, such that we can focus on the right ones.
The war in Ukraine is not the main reason inflation is high
The war in Ukraine is so terrible in so many ways, and causes so many challenges and uncertainties, but it is not – even when people often say so, in particular in Europe – the main reason inflation is high.
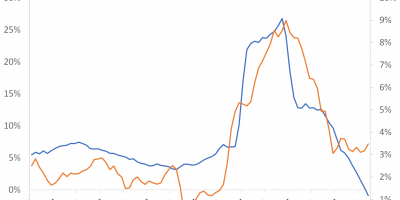
Perhaps this is most clearly demonstrated in Figure 2 that zooms in on inflation developments in the euro area, U.S., and across OECD countries during the past 1.5 years. In Figure 2, I highlight the timing of the Russian invasion (February 2022) by a vertical line.

Figure 2 reveals that inflation has been steadily and persistently increasing during the past 1.5 years. It was increasing before the war in Ukraine, and it has been increasing afterwards. In February 2022, i.e. before the Russian invasion, inflation was 5.9% in the euro area, 7.9% in the U.S., and 7.8% across OECD countries. Logically, inflation did not rise during 2021 because of the war in 2022.
I am not saying that the war did not have any effect. It did, in particular in Europe. In the euro area, inflation was 5.9% in February and increased to 7.4% in March, a significant jump. But inflation was, as mentioned, already terribly high at 5.9% in February, i.e. before the war.
I am also not saying that the war will not make things worse. It most likely will, in particular in Europe. Like so many others, I am very concerned about gas deliveries from Russia. Lower supply of gas will raise energy prices even further.
However, when we search for underlying reasons why inflation is high, Figure 2 makes clear that the war in Ukraine cannot explain why inflation was much too high before the war and that trend growth in inflation is the same before and after the war.
What causes inflation?
Inflation means firms raise prices on stuff we buy. They do so when demand for what they produce is high relative to what they supply. This is a fundamentally correct explanation, but it is not a particularly good one. Or, more precisely, not a sufficient explanation. We need to explain why demand is high relative to supply. Or, similarly, we need to understand why supply is low relative to demand.
My explanation goes as follows. We had a terrible recession in early 2020 because of the pandemic. Demand fell abruptly and dramatically. Inflation dropped. Governments and central banks came to the rescue, launching very expansionary policies. After the shock, demand bounced back, supported by fiscal and monetary policies. We started demanding other things than we usually buy. Demand shifted from services to goods. Expansionary policies continued for much too long, stimulating inflation further. At the same time, supply chains were impaired by the pandemic. Demand was high relative to supply. Prices rose, in particular prices of raw material. Raw materials are used in many parts of the production process, causing firms to raise prices even further.
So, inflation is high because (i) demand was high after the initial phase of the pandemic, (ii) demand was stimulated by expansionary fiscal and monetary policies, (iii) demand shifted from services to goods, causing prices, in particular (iv) commodity prices, to increase.
- High post-pandemic growth
The pandemic caused a pause in economic activity. We sent children home as we closed schools, we sent workers home, we sent students home, etc. Economic activity came to an almost complete halt, unemployment sky rocketed, and stock prices fell dramatically.
It is useful to recall graphs I used to illustrate the economic consequences of initial phase of the pandemic (link, link, and link). Let me repeat just one graph here. Do you remember how unemployment exploded? Figure 3 shows initial jobless claims in the U.S. on a weekly basis.

I wrote something like this (link): “Initial claims for unemployment insurance in the U.S. have been published every week since 1967. On average, historically, 350,000 people enter unemployment every week (on average, more or less the same number of people find a new job every week). Pre-corona it peaked at 700,000 in October 1982. During the financial crisis, it rose to 665,000 (March 2009). In mid-March 2020, the number was a staggering 3,3 million, only to reach more than 6 million people getting unemployed during the first week of April 2020. In the course of four weeks, 22 million people lost their job. It is mind-blowing. And very sad.”
Even if it was a dramatic recession, it was a short-lived one (link). Nevertheless, we received all kinds of support to manage the lock-down. This meant that when we returned to school, returned to work, and so on, we had money to spend. In spite of the massive increase in unemployment, the personal savings rate exploded from below 10% before the pandemic to more than 30% in April 2022 (link). We had money to spend and we longed for doing so.
Figure 4 illustrates this. It shows how the release of pent-up demand caused economic activity to rebound strongly in 2021. In 2021, economic activity grew at its highest rate in several decades.

We conclude that demand was very strong right after the first phase of the pandemic.
2. Expansionary policies
So, demand was high in 2021, but how could we pay for all those things? The answer: Very expansionary fiscal and monetary policies.
Fiscal policy first. Fiscal policies were unusually expansive.
Normally, people face hardship during recessions. That is why recessions are bad. People’s income falls. Figure 5 illustrates this. The figure shows how people’s real disposable income usually falls when real GDP falls. During the financial crisis of 2008-09, for instance, the economy contracted (GDP fell) and so did the growth rate of people’s income. GDP contracted by app. 2.5% and real income growth fell to 0%.

The pandemic was different. During the 2020 recession, the economy contracted strongly. In fact, it even contracted more than during the global financial crisis. Nevertheless, people’s income rose. Economically, people did fine because of government support. We had money to spend.
Monetary policy was extremely expansionary, too. Central banks lowered policy rates and bought bonds to the tune of many, many billions of EUR, USD, GBP, etc. Central bank balance sheets ballooned, Markets were flooded with liquidity. If inflation is “always and everywhere a monetary phenomenon”, monetary policy must take some responsibility here.
I am not critical towards the expansionary policies in the early phase of the pandemic. We were in a state of shock. We had literally no idea what would happen. Hence, supporting households and firms in the early phase of pandemic made a lot of sense.
The problem was that it continued for far too long. In autumn last year, inflation was running at 3%, 4%, 5%, 6%, and monetary policy rates were still very low (negative in Europe, zero in the U.S.), and Fed and ECB continued buying bonds to the tune of billions of USD and EUR. This meant that inflation was just going higher and higher. Instead of raising rates and stopping bond purchases, central banks did not adjust, thereby contributing to raising inflation instead of bringing it down.
Continued expansionary policies were of first-order importance for the strong post-pandemic demand. A huge policy mistake.
3. Goods/services demand shifts and supply-chain challenges
So, demand was high during 2021 because of very expansionary policies.
Demand also shifted, from services to goods. When demand is already high, and then turns even higher for goods, prices of goods will have to give. We have inflation.
The pandemic implied that we had to stay home. We could not go to restaurants, we could not travel, we could not go to sports events and concerts, and so on. Basically, we could not spend our money on services.
At the same time, given that we had to stay home and work from home, we needed an extra office chair, an extra computer screen, we saw that we needed a new sofa because we got tired of looking (day in and day out) on that old sofa, the kids needed one more Playstation and iPad, and so on. We increased our demand for goods.
This shift in demand, from services to goods, is remarkably clear in the data. Figure 6 shows the ratio of personal consumption expenditures on goods in the U.S. relative to total personal consumption expenditures. Basically, the figure shows how much is spent on goods for every USD 100 of consumption.

The fraction of consumption spent on goods has been persistently falling since 1960. In 1960, every time a U.S. household spent USD 100 on consumption, 53 of them were spent on goods. Right before the pandemic, this had declined to 31.
This persistent decline was dramatically interrupted because of the pandemic, Figure 6 shows. There is a clear upward jump in the ratio of goods expenditures to total consumption expenditures.
There is another way to say this. From June 2020 through June 2021, consumption of services increased by 12%. Consumption of goods by considerably more, by 17%.
Again, the fact that consumption of goods increased more than the consumption of services is a post-pandemic phenomena. Before the pandemic, consumption of services rose more. In 2020, consumption of goods was 25 times higher than in 1960 (in nominal terms). Consumption of services was 56 times higher.
Firms were taken by surprise, because we have historically demanded fewer and fewer goods (relative to services). Now, we suddenly demanded more goods. This increase in demand for goods pushed up prices on goods.
In addition, goods need to be produced in the first place and then transported to consumers. Often, they must be transported from far away. But factories were closed because of the pandemic, and ships could not enter the harbors (link). Supply-chains were impaired. The goods we wanted to buy could not be produced, because factory workers had to stay home, and when it nevertheless was produced, it could not be delivered to us. Demand goes up and supply down. The effect is obvious. Prices rise.
But if demand for services was relatively weak (while demand for goods was high), prices of services should fall, moderating overall inflation. This did not happen though. First, consumption of services did rise, as mentioned above, even when it rose less than demand for goods. Second, service prices are relatively sticky, meaning high inflation in goods prices was not offset by low inflation in service prices.
Can we even quantify the fractions of inflation that are due to demand and supply? San Francisco Fed provides help here. They divide spending categories in the personal consumption expenditure basket into supply- and demand-driven groups (read the paper to see how they do this, link), and an ambiguous part. The decomposition is shown in Figure 7.

Figure 7 shows that demand and supply are both important drivers of current inflation. Demand was the main driver of inflation when it started rising in early 2021 while supply factors started kicking in during 2021 and have become ever more important since then. At the last observation, June 2022, demand pressures account for roughly a third of inflation, supply roughly half, and the rest cannot be clearly classified (notice that the San Francisco Fed does this decomposition for PCE inflation, not CPI inflation. PCE inflation was 6.6% in June 2022 vs. 8.5% for CPI inflation).
4. Rising commodity prices
High post-pandemic growth, caused by expansionary fiscal and monetary policies, coupled with severe supply-chain disruptions, caused commodity prices to rise, as Figure 8 shows. The figure shows the “All Commodity Price Index” developed by the IMF. Globally, and across commodities, prices were relatively stable prior to the pandemic, but surged right after the first wave in 2020.

Many types of commodities became more expensive. Oil prices rose, food prices rose, agricultural prices rose. Some rose more than others. Today, gas prices are six times higher than in 2016, copper prices seven times higher, nickel prices twenty times higher, and so on.
If prices of raw materials rose for the same reasons that other prices rose, that is high demand coupled with supply-chain disruptions, why then highlight the changes in prices of raw materials? Are they special? They are, because they are used in the production process of many goods and services. If petrol prices rise, transport becomes more expensive, pushing up prices of those things that are transported. If wheat prices rise, it becomes more expensive to bake bread, raising prices in bakeries, and so on. Rising commodity prices can cause inflation, which is why I mention rising commodity prices as a forth reason why inflation is high.
Will inflation come down easily?
Inflation is high because demand is high relative to supply. Demand has been high because of expansionary policies, and demand has shifted from services to goods. Supply chains have been impaired. How long will all this last?
The pandemic-induced disruptions to supply chains will be dealt with (ports and mines will/already are open). Expansionary policies will be/have been scaled back. Some of the underlying inflationary pressures will vanish by themself.
There is one important exception to this, though: The supply of gas and other raw materials from Russia. This could last longer, pushing up inflation, in particular in Europe. But other supply-chains disruptions should evaporate.
What makes the situation so difficult is that expansionary policies have caused an overheated economy. House prices have increased too much, pushing up rents, the labor market is very tight, and so on. As a result, inflation is now broad-based. It will be difficult to get inflation back to target.
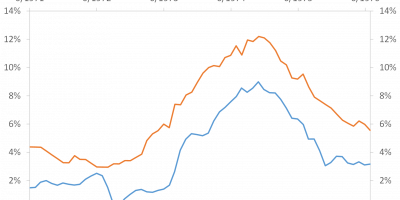
The last graph today illustrates this. The Atlanta Fed has developed a method that decomposes overall U.S. inflation into flexible and sticky components (link). Flexible components are components that move fast. Sticky move slowly. It will take time before sticky components start rising, but it is dangerous when they do because it will take time to bring these prices down again.

Figure 9 shows that flexible components were the main drivers of inflation in the beginning. This was for instance the increase in energy prices. Lately, sticky price inflation has moved up, though. Today, sticky-price inflation is close to 6%. Inflation is here to stay.
Conclusion
Inflation is at its highest level in four decades. Inflation is high because demand was high after the initial shock of the pandemic. At the same time, supply-chains were disrupted. Demand was spurred by expansionary fiscal and monetary policies. High demand means a tight labor market and broad-based inflation. It will require sacrifices (read: recession) to get inflationary under control.