
So far in 2023, only 7 stocks have generated more than 70% of the return of the world’s leading stock market index, the S&P 500. The other 493 stocks generated the much smaller remainder. A market that depends so heavily on the performance of so few stocks is a fragile market. It is also a market that raises fears of bubbles and has implications for stock selection. This analysis is the first of two on these topics. The next analysis will compare the situation today with the situation before the dot.com bubble burst in 2000.
At the beginning of 2023, the market value of all stocks included in the S&P 500 was $32.1 trillion. At the end of August (I am writing this post on 24 August 2023), the market value is $37.1 trillion. So the value of all the stocks in the S&P 500 has increased by 15.3% in 2023. That’s a nice return considering we are only talking about eight months.
The S&P 500 consists of the largest (most traded) stocks in the US. It is the world’s leading stock market index. Therefore, it is important to understand what drives it, not least for assessing the robustness/fragility of its performance.
In this analysis, I look at the performance of stocks referred to by some as the “Magnificent seven” (Mag7, for lack of a better acronym; link). These are: Alphabet, Amazon, Apple, Meta, Microsoft, Nvidia, and Tesla.
I compare the performance of these seven stocks with the performance of the other 493 stocks in the S&P 500. The funny thing – or not so funny, depending on how you look at it – is that most of the performance of the overall market, i.e. all 500 stocks in the S&P 500, comes from the performance of these 7 stocks, not from the performance of the other 493. Here are some key figures:
- The combined market value of all 500 stocks in the S&P 500 has increased by $5 trillion or 15.3% in 2023, as mentioned.
- Leaving Mag7 out of the equation, the value of the remaining 493 shares has risen from $26 trillion to $27 trillion today, a return of only 4.5%.
- Consequently, Mag7 stocks have provided a 10.8% increase in the S&P 500.
- This means that only 7 out of 500 stocks generated 10.8%/15.3% = 71% of the return of the S&P 500 in 2023. The remaining 493 stocks delivered the remaining 29%.
This is crazy. This was certainly a rally driven by very few stocks – not a broad-based rally.
The calculations above show what it looks like today. In Figure 1, I have decomposed the total return of all the stocks in the S&P 500 into the part that comes from Mag7 and the part that comes from the remaining 493 stocks. As can be seen from the chart, the return of the S&P 500 was generated by these seven stocks during most of the year.

Source: Datastream via Refinitiv and J. Rangvid.
There is another way to illustrate the importance of Mag7 for the development of the total market. Figure 2 shows how the total value of Mag7 stocks has evolved in 2023, and how the value of the other 493 stocks has evolved, normalised to “1” at the beginning of the year.

Source: Datastream via Refinitiv and J. Rangvid.
It has been a banner year for Mag7 shares. Together, they have risen by 60% in 2023 (adding 10.8% to the index alone). The value of the other 493 shares has only increased by 4.5%.
The last ten years
While the trend in 2023 is extreme, it is nevertheless part of a long-term trend. Since 2013, the total value of all companies in the S&P 500 has increased by 191%, from $12.7 trillion to the aforementioned $37 trillion today. Leaving aside Mag7, the cumulative gain of the remaining 493 stocks is 130%, meaning that Mag7 has contributed to a 61% increase in the S&P 500 over the past decade. So since 2013, about one-third of the growth in the total value of all companies in the S&P 500 has been due to the growth of seven stocks, the Mag7.
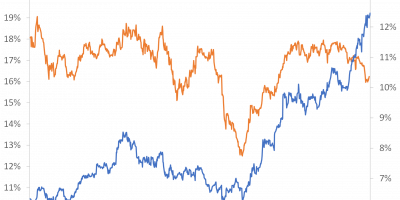
This of course means that Mag7 carries more weight in the index, as Figure 3 shows. At the beginning of 2013, the total value of Mag7 stocks accounted for 8.4% of the total value of all 500 stocks in the S&P 500. Today, these seven stocks account for 27.5%.

Source: Datastream via Refinitiv and J. Rangvid.
Figure 3 gives rise to further interesting conclusions. On 1 January 2013, Mag7 accounted for 8.4% of the S&P 500, as mentioned. Over the next 5-6 years, Mag7 stocks consistently rose faster than the other 493 stocks, and their weighting in the index increased steadily. Then there was a sharp upturn. If you look closely at the chart, you can see that the upswing started before the pandemic. In the autumn of 2019, Mag7 stocks accounted for 16% of the total value of all 500 companies in the S&P 500. By early March 2020, i.e. just before the lockdown, this share had risen to 20%, a significant increase. In the early stages of the pandemic, Mag7 continued its sprint. On 1 September 2020, for example, Mag7 had a 27.4% share of the index.
2022 was a bad year for all stocks, but especially for Mag7: What goes up fast, comes down fast. From March 2022 to January 2023, Mag7 shares lost 36%. The other 493 shares lost “only” 17%. Now, during 2023, this has reversed, with Mag7 performing spectacularly compared to the rest of the market. It is clear that Mag7 have had a wonderful performance, but it is equally clear that it has been a very volatile performance.
Mag7 stocks
While the return on all seven Mag7 shares was excellent, with each returning more than 30% in 2023, Nvidia’s performance was in a class of its own. Figure 4 shows that Nvidia’s market value has increased by almost 250% since the beginning of the year. At the beginning of the year, Nvidia accounted for 1% of the total value of all 500 stocks in the index. Today, that single stock accounts for more than 3%. Truly spectacular.

Source: Datastream via Refinitiv and J. Rangvid.
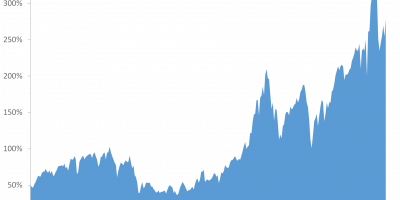
Figure 5 shows the development of Nvidia’s market value over the last ten years. Nvidia’s market value has increased 150-fold since 2013. The market value of the overall index has increased 2-fold (the 191% mentioned above). No comment required.

Source: Datastream via Refinitiv and J. Rangvid.
Let me conclude by briefly mentioning two broader implications of the developments described here.
Stock picking
While the developments described above are interesting in their own right, they also have important implications for the debate between active and passive investment. One can look at the debate from two angles.
On the one hand, the fact that seven out of 500 stocks were so important for the return of the whole market indicates that it is difficult to pick the right stocks ex ante. It is easy to identify these stocks today, ex post, but as an investor you naturally want to find them before they take off, and before everyone else does. But how are you supposed to find those few stocks among the 500 stocks out there? There is a real risk that you will not find the needle in the haystack, that you will not be able to identify the winners ex ante.
On the other hand, the fact that the market was driven by the performance of these few stocks means that the potential return of stock picking (active investing) is enormous. If – and this IF is at the heart of the debate – you can find the winners a priori, the payoff is amazing. Successful stock pickers, i.e. investors who focused their investments on Mag7, had a good run.
A bubble?
Second, the spectacular outperformance of these few stocks is reminiscent of the dot.com bubble at the turn of the millennium. Then, as now, a lot of hype was made about a few individual stocks that rose spectacularly within a very short time. The problem, of course, was that it was a bubble. Some of the stocks that rose so dramatically subsequently crashed completely.
Take Cisco as an example. Cisco’s market value at the beginning of 1998 was $57 billion. At its peak in September 2000, it had risen to $482 billion, almost tenfold. And that was within just 2.5 years. Then the bubble burst. Half a year later, in spring 2021, Cisco had lost 80%(!) of its value and was “only” worth USD 80 billion. The question is whether the market trends are the same today as they were then. I will explore this question in my next analysis.
Conclusion
The world’s leading stock index, the S&P 500, has been dominated by a select few stocks, especially this year, but also over the past decade.
The fact that the market is driven by such a small number of stocks is worrying because it means, of course, that if just one, two or three of these stocks weaken, there is a risk that the market will falter. The market is simply too dependent on the performance of a handful of stocks.
One can only speculate whether these shares are bubbles. The spectacular performance of Nvidia, for example, is reminiscent of the performance of hyped stocks during the dot.com bubble at the turn of the millennium. That is a scary thought. When the dot.com bubble burst, the entire market crashed. I will compare today’s moves with those of the dot.com bubble in my next analysis (which means that the analysis I promised you last time, link, on why the economy is so strong despite the sharp rise in interest rates will be a little delayed).