
Interest rates have risen dramatically over the last two years, but will they stay this high or will they return to previous lows? No one knows, but analysing whether the underlying fundamental level of interest rates has risen gives us clues as to the future direction of interest rates. I present two approaches. They provide different answers. I will tell you which one I prefer.
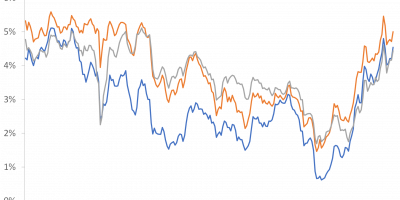
Interest rates have risen in recent years, and drastically so. In many countries, monetary policy rates were close to or even below zero before the pandemic, but now they are hovering around 4, 5 or 6 per cent. This has pushed up other interest rates. The current rise in interest rates is particularly spectacular in that it has interrupted a four-decade period of steadily falling interest rates, as Figure 1 shows.

Source: Datastream via Refinitiv and J. Rangvid.
But why have interest rates risen? Is it just because central banks have raised their policy rates and other interest rates have adjusted accordingly, or is there something more fundamental behind it?
This is an important question. If interest rates have only risen because central banks have raised interest rates, there is good reason to believe that interest rates will return to pre-pandemic lows once inflation is under control and central banks lower rates again. However, if the underlying level of interest rates in the economy has risen, we should expect interest rates to remain higher for the foreseeable future.
The natural rate of interest
We can see when central banks change their interest rates, and we can see what interest rate we pay on our mortgage loan, our car loan, our student loan, and so on. But that alone says nothing about the “fundamental” level of interest rates in the economy. So what is that?
Economists use many terms for what they consider to be the “underlying fundamental rate of interest”:
- The natural rate of interest.
- The neutral rate of interest.
- The long-run equilibrium level of interest rates.
- r-star, or r*.
The term “r-star” has become established in studies and speeches by central banks, so I will also use this terminology.
Different researchers/institutions define it differently: Richmond Fed (link) defines r* as “a hypothetical interest rate that is consistent with economic and price stability”, New York Fed (link) calls it “the real short-term interest rate expected to prevail when an economy is at full strength and inflation is stable”, while the IMF calls it (link) “the real interest rate that would keep inflation at target and the economy operating at full employment – neither expansionary nor contractionary”. The last sentence – “neither expansionary nor contractionary” – means that monetary policy neither stimulates nor reduces economic activity when the monetary policy interest rate is equal to r*. In such a situation, monetary policy is neutral.
How do we measure r*?
We cannot observe r*, so it must be estimated. Recall that r* is the real interest rate that prevails when the economy is operating at full capacity and inflation is stable. Therefore, researchers often model how economic activity and inflation evolve so that you can work out r* as the level at which these variables are in equilibrium. Typically (see for example here: link), researchers rely on variants of the following relations:
- Economic activity is modelled as an intertemporal IS curve, i.e. a relationship between output (or the output gap, i.e. the difference between current and potential output), past output gaps and the lagged real interest rate gap (the difference between the real interest rate and r*).
- Inflation is determined by a Phillips curve, i.e. past inflation and the lagged output gap.
- r* evolves over time with trend output growth and other variables that influence r*.
Using intelligent econometrics (e.g. Kalman filters, which allow researchers to back out estimates of otherwise unobservable variables), one can extract from these relationships measures of trend growth, the output gap, other variables that affect r*, and finally r* itself.
Has r* increased?
Now that we have introduced r* and know how to estimate it, we can discuss what we are here for: To assess whether the underlying fundamental interest rate r* has risen.
And here’s the bottom line: researchers disagree.
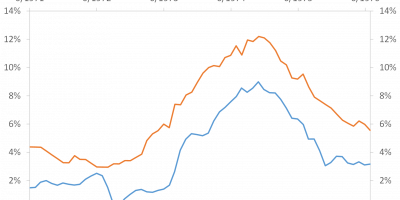
Start with perhaps the most widely used estimate of r*, that of the New York Fed (link). The NY Fed was the first to publish estimates of r* and updates them regularly. On its website, it publishes the results for the US, the euro area and Canada. I show r* for the euro area and the US in Figure 2.

Source: New York Fed and J. Rangvid.
Figure 2 shows that r* is currently very low. The latest estimates show that r* is negative(!) in the eurozone at -0.2% and less than 1 % in the USA at 0.6%. In other words, despite the sharp rise in interest rates in recent years, there is no clear evidence that the underlying fundamental level of interest rates in the economy has risen.
r* is an estimate of the equilibrium real interest rate. If r* in the eurozone is -0.2%, this means – assuming underlying inflation of 2%, which is in line with the ECB’s inflation target – a nominal equilibrium interest rate of almost 2%.
Earlier this year, the NY Fed published a study analysing whether the pandemic and its consequences have led to changes in r* (link). There has been a lot of talk about a new global economy with greater uncertainty due to the geopolitical situation, deglobalisation, higher debt, etc., which some argue has led to a rise in underlying interest rates. The NY Fed firmly rejects this. It argues that the underlying level of interest rates is as low as it has been for the last 10-15 years.
The New York Fed estimates two versions of r* for the US, one version that it uses only for the US and one version that it can use for both the US and the euro area (link). The version it estimates for the US only has risen somewhat over the last ten years, by around 50 basis points to around 1%, while the version used for the international area (see Figure 2) has not. This means that, depending on which exact model is used, r* in the USA has either not risen at all (Fig. 2) or has risen only slightly. The conclusion of the President of the New York Fed, John Williams, is (link): “Importantly, there is no evidence that the era of very low natural rates of interest has ended.”
In contrast to the NY Fed, the Richmond Fed finds that r* has risen (link). The Richmond Fed is concerned that the approach used by the NY Fed depends too much on the specific assumptions of the theoretical model used to calculate r*. Hence, the Richmond Fed uses a model that is theoretically less rigorous but statistically more flexible. It determines r* by assuming that r* and the observable real interest rate converge in the long run. More precisely, they assume that r* converges to “the conditional long-horizon forecast of the observed real rate over a 5-year period”. The result is shown in Figure 3. The Richmond Fed estimates r* only for the US, i.e. not for the euro area.

Source: New York Fed, Richmond Fed and J. Rangvid.
The Richmond Fed notes that r* has risen by almost 1.5 percentage points between 2015 and today. In 2015, r* was around 0.8%, today it is estimated to be around 2.3%. If underlying inflation is 2% (the Fed’s target), this implies a nominal interest rate of more than 4%, which is not far from current market rates. If true, this means that monetary policy is not very tight today. It also means that we should not expect a sharp fall in market interest rates when inflation returns to target.
Compare that with the NY Fed’s estimate. Here the neutral rate is 0.5%-1%, which means monetary policy is tight today and we should expect a rate cut when inflation returns to target.
What drives r*?
So we have one branch of the Fed saying that underlying interest rates in the economy are as low as they were before the pandemic, both in the US and in the euro area, and another branch of the Fed claiming that underlying interest rates in the US have risen by about 1.5 percentage points. People have noticed these differences (link, link), but few have discussed what causes them and what to believe. Let me give my views.
One place to start might be to look at what drives r* in the different models.
The New York Fed model, as mentioned, is relatively closely tied to a theoretical economic model. In their framework, the law of motion for r* is closely related to trend growth in output, as shown in Figure 4.

Source: New York Fed and J. Rangvid.
The main reason that the equilibrium interest rate in the US has fallen in the NY Fed model is that underlying economic growth has fallen. Before the financial crisis, trend growth and r* tracked each other very closely. Due to the financial crisis, underlying trend growth in the US fell by one percentage point – an important finding in itself(!), but that is for another day – while r* fell even more, by almost two percentage points. Since then, the movements in trend growth and r* have become strongly correlated again, although r* is still around one percentage point below trend growth.
As already mentioned, the Richmond Fed model is less strict from a theoretical point of view, but more flexible from a statistical point of view. This means, for example, that the model does not specify a clear relationship between trend growth and real interest rates, but lets the data speak for itself. This sounds good at first glance, but it also brings with it some challenges.
Since we cannot observe r*, you need some identifying assumptions. As mentioned above, an important assumption of the Richmond Fed model is that r* converges to the real interest rate. The real interest rate is the nominal interest rate minus inflation expectations. It turns out that the Richmond Fed r* is strongly influenced by inflation expectations, in particularly up until the pandemic in early 2020 (correlation: 0.85!), as Figure 5 shows.

Figure 5. 5-year inflation expectations (Fed Cleveland expectations) and r* (from Richmond Fed) in the US. Q1 2000 – Q2 2023.
Source: Richmond Fed, Datastream via Infinitiv and J. Rangvid.
I don’t know about you, but I’m a little uncomfortable with inflation expectations playing such a large role in estimating the underlying equilibrium level of the real interest rate in the economy. The real interest rate is what is left of nominal interest rates after accounting for inflation expectations. While we could argue that fluctuations in inflation expectations have an impact on real interest rates via an inflation risk premium, it is hard to see why the level of the real interest rate should be determined by the level of inflation expectations.
Even if the close relationship between inflation expectations and real interest rates implied by the Richmond Fed model has weakened during the pandemic, as Figure 5 shows, it nevertheless suggests that one reason for the rise in the Richmond Fed r* is that inflation expectations have risen. I’m not sure I find that convincing.
Second, the estimate of r* in the Richmond model has been very volatile in recent years, as shown in Figures 3 and 5. With such high volatility, it is unclear whether the recent increase is only temporary or will soon recede.
Conclusion
Whether the underlying fundamental level of interest rates has risen or not plays a major role in our thinking about the current stance of monetary policy and where interest rates will generally be heading in the future. Unfortunately, the underlying level of interest rates cannot be observed but must be estimated. I discuss two well-known estimates. One, from the NY Fed, suggests that underlying interest rates are still very low, while the other, from the Richmond Fed, suggests that they have been rising recently.
My reading of this is that the estimate from the NY Fed – at least for now – appear more robust. Or, more directly, I do not think underlying real interest rates have risen.
Low equilibrium interest rates have important implications. Let me conclude by mentioning at least two of them.
If underlying equilibrium real interest rates had risen, monetary policy would not be tight right now and would explain why we have not yet experienced a recession. On the other hand, if r* has not risen, monetary policy is tight. I’m leaning towards the latter. I think the economy has been amazingly resilient because people saved a lot coming out of the pandemic (link), coupled with a very expansionary fiscal policy that is also supporting growth, not that monetary policy is not tight.
Second, if underlying real interest rates are low, interest rates should fall when inflation is under control and monetary policy rates are lowered. Perhaps interest rates will not become quite as low as before the pandemic (e.g. negative interest rates in Europe), but should be significantly lower than today.
And that brings me to what I will discuss in my next analysis: If r* is low today, will it stay low, i.e. what does the future of r* look like? Stay tuned.