
Despite last year’s dramatic rise in central bank and market interest rates, underlying equilibrium rates have risen only little, I concluded in my last analysis (link). But this is now, what about the future? I look at the evidence and conclude that the future looks rosy, i.e. equilibrium interest rates will remain low. However, there is an elephant in the room.
The equilibrium, or natural (or neutral), interest rate, often called r* (or r-star), is the real interest rate prevailing when the economy is in equilibrium, i.e. production equals its potential and inflation is stable. r* plays an important role in economic analyses as it tells us where interest rates will be when all temporary shocks to the economy have dissipated, i.e. it tells us where interest rates are ultimately heading. It also gives us information about the current stance of monetary policy. If the current (real) monetary policy rate is above r*, monetary policy is tight, otherwise it is not.
We cannot observe r* directly, so it must be estimated. Different researchers use different methods, which sometimes leads to debates about the actual value of r*, as I described in my last analysis (link). However, almost all analyses agree on the general trends, i.e. that equilibrium interest rates have fallen in recent decades. Most of them also agree on the outlook of r*, as I explain in this analysis.
Evidence from the US
Let us first look at the estimates for the USA and then for the global economy.
In the New York Fed’s famous estimates of r* (link), the law of motion for r* is governed by trend output growth. So, one way to think about the future prospects of r* is to think about the future path of real economic growth. In Figure 1, I show r* and trend growth, as estimated by the NY Fed since the early 1960s, along with projections of real potential output in the US, taken from the Congressional Budget Office. Projections of real potential output are for the next three decades.

Source: NY Fed, CBO and J. Rangvid.
Firstly, Figure 1 shows the close historical relationship between trend growth and r*, which the NY Fed model specifies. As trend growth has fallen from around 6% in the early 1960s to around 2% today, r* has also fallen. Second, and probably the main message here, expected underlying economic growth in the US will be around 2% per year, with a slight decline over time. If r* continues to be related to underlying trend growth, which most economic models assume, r* will be low going forward.
Note that r* fell more sharply than trend growth after the financial crisis, and the gap between the two has continued since then, with r* being stuck around 0.5-1 percentage points below trend growth. Perhaps this gap will close, such that the otherwise historically close relationship between the two is restored. In this case, r* will rise from its current level of around 1% to around 1.5%. If inflation will be close to the inflation target of 2%, this means that the nominal equilibrium interest rate will be around 3.5% in the future.
Let’s look at one more study for the USA. IMF published a major study last year looking at why r* has fallen in recent decades and what the future holds for r* (link). While the NY Fed model assumes this close (theoretically based) relationship between economic growth and r*, the IMF study allows for other structural changes to affect r*. In Figure 2, I have summarised IMF’s conclusions with respect to the causes of the decline in r* in the US between 1975 and 2015, the period they studied.

Source: IMF and J. Rangvid.
IMF finds that r* fell by 2.2% between 1975 and 2015. That’s not far from what the NY Fed finds (it finds that r* has fallen from 3.4% in 1975 to 0.6% in 2015, i.e. a 2.8 percentage point decline). IMF concludes that slower economic growth (productivity growth) was the most important factor behind the decline in r*, explaining 1 percentage point of the total 2.2 percentage point decline. Other important factors were demographics, i.e. the fact that we are living longer (we have a higher survival rate today than in 1975), increasing inequality (more of the income growth goes to the already rich, and the richer save more, which pushes down interest rates) and higher government debt (which pushes up rates).
IMF uses its model to predict the future development of US r* up to the year 2150! This is shown in Figure 3.

Source: IMF
IMF forecasts that the r* will reach a low of 0.38% in 2031 and then gradually rise to around 1%.
According to the IMF, two main effects drive up interest rates after 2031. Firstly, the large generation of baby boomers will retire around 2030, which means that this generation will use up its savings. Lower aggregate savings mean higher interest rates. The second factor is the sharp rise in US government debt.
Collectively, these studies conclude that equilibrium real interest rates will be low in the future. Not as low as right before the pandemic, but significantly lower than before the financial crisis, probably around 1-1.5%. Assuming 2% inflation, this means nominal interest rates around 3-3.5%.
Global evidence
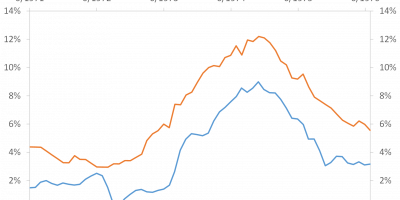
Most of the research has been done for the US, which is why I covered this topic first, but IMF researchers have looked at the global evidence. In a fascinating recent analysis (link), IMF researchers estimate r* for 16 advanced economies for the last 150 years and then examine common trends. I reproduce this in Figure 4.

Source: IMF.
Figure 4 shows that the average across- countries equilibrium real interest rate has fallen dramatically since the early 1980s. Global r* was around 6% in the late 1970s but fell to less than 1% before the pandemic. Hence, low r* is not a US phenomenon, but a global one.
Will global equilibrium interest rates also be low globally in the future?
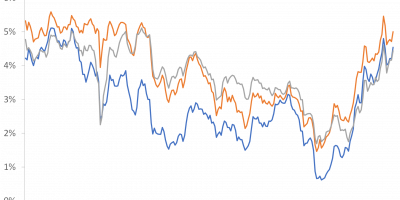
In its April 2023 WEO report (link), IMF discusses the future of r* in light of the massive interest rate hikes we have seen in 2022 and 2023. I show their predictions for r* in several major economies in Figure 5.

Source: IMF and J. Rangvid.
Figure 5 shows that, according to the IMF’s best estimate, r* will remain low in advanced economies such as Germany, the UK and the US and will fall to a similarly low level in emerging economies such as China and India. While we detect a weak tendency for r* to rise from 0.6% today to 0.75% in the US in 2040, the IMF’s main message is that equilibrium interest rates will remain low: “Our analysis suggests that recent increases in real interest rates are likely to be temporary”.
Elephant in the room
So, the conclusion from all this is that most analyses still conclude that future equilibrium interest rates will most likely be low. I broadly agree. At the same time, I think there is in particular one thing that could alter this picture: very high debt levels.
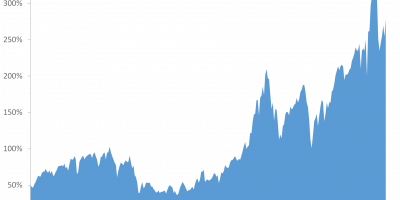
Let me give you an example. Figure 6 shows the projected development of US federal debt in relation to US GDP. It’s a frightening picture.

Source: CBO and J. Rangvid.
Debt has typically increased as a result of major shocks, e.g. after the First and Second World Wars, the Great Depression, the global financial crisis and the pandemic.
After the First World War, debt (as a fraction of GDP) was reduced until the next shock came, the Great Depression. Debt then stabilised until the next shock, the Second World War. After that, debt was reduced again.
The financial crisis and the pandemic, as well as the policy decisions made in response to these shocks, have led to a huge expansion of debt, which now stands at 100% of US GDP, a level that has only been seen once in the last 120 years, right after the Second World War.
The problem now is that there is currently no sign that this debt will be brought down. Under current policies and the best projections available to the CBO, the debt will nearly double in the next 30 years, reaching almost 200% of GDP.
This debt explosion will have a number of negative consequences, but the one I am focusing on here is the impact on equilibrium interest rates.
Let us start with some arguments why we should not be too afraid, before turning to opposite arguments. Firstly, the analyses mentioned above, particularly those of the IMF, explicitly include such debt projections and conclude that interest rates will remain low, as mentioned. Secondly, studies on the impact of debt on interest rates generally show a positive but small effect. Third, a causal test would conclude: “Hey, look at Japan. Debt to GDP is over 200%, and Japanese interest rates are still very low, so what’s the problem”?
The problem is that the relationship between debt and interest rates is a subtle one. It depends on trust.
If investors have confidence that the US government will repay its debts, it may be correct that those debts are affordable and will not greatly affect interest rates.
But if confidence is lost, interest rates could react much more strongly. If investors become afraid that US creditworthiness is at risk, the reaction of interest rates could be greater. This is not something we should take lightly. In August, Fitch lowered its rating on the US (link) due to “eroding governance, rising government deficits, increasing debt” and concerns that medium-term debt problems are not being addressed. Fitch based its downgrade on the outlook for the next decade. However, Figure 6 shows that the problems will persist thereafter unless policy changes are made. In this case, there is a high probability that we will move from a good to a bad equilibrium, in which investors will demand a significantly higher risk premium for US debt, pushing up equilibrium interest rates.
I am not saying that this must happen. I am just saying that I think exploding debt, particularly in the US, is probably the biggest risk to the base case scenario of low equilibrium interest rates in the future.
Climate risk
In addition to rising debt, there has been much discussion about the impact of climate risk on equilibrium interest rates.
There are two main effects. On the one hand, the large investments needed to finance the transition to a more stable economy put upward pressure on interest rates. On the other hand, the risk of severe negative climate events can lead to more precautionary savings, which exerts downward pressure on interest rates. In a comprehensive review of the literature (link), ECB researchers conclude that “although in some simulations r* is positively affected – especially in scenarios with productivity-enhancing innovations – most simulations suggest that the impact of climate change would reduce r*”. So, as it stands, the inclusion of climate risk does not change the general conclusion that r* will be low in the future.
Conclusion
After the sharp rise in interest rates last year, we are all wondering whether we are facing a future in which interest rates are permanently higher than we have been used to, or whether interest rates will return to the lows of the period before the pandemic. Nobody knows. But examining underlying equilibrium interest rates could at least give us some clues as to the future direction of interest rates.
Most papers analysing this conclude that the forces that drove interest rates down until the pandemic are still with us. Therefore, the underlying equilibrium interest rates will most likely remain low in the future. Not as extremely low as immediately before the pandemic, but lower than 10, 20, 30 years ago.
The main uncertainty with respect to these projections is the development of debt that we see in many countries. Maybe interest rates will not react even if debt increases, but maybe they will. Trust is a knife-edge thing. If investors trust you, interest rates may not react very much, but if investors fear that debt is too high, they will react. And of course, the higher the debt – and it will be very high – the greater the likelihood that investors will lose confidence. This is perhaps the biggest risk to the long-term outlook for interest rates.
Finally, let me emphasise what I am saying so that I am not misunderstood. I am saying that rates are likely to be low in the long run, compared to the historical average of recent decades, but not as low as immediately before the pandemic. That means we should not expect rates to be very much lower than they are today, a little lower, but not very much. An example, which is not a prediction but is meant to illustrate the point, is that a nominal r* of around 3.5 is probably not a super crazy assumption. With the 10-year Treasury bond currently trading at just over 4%, this implies slightly lower rates than today, but not much lower rates.