The rebound in stock markets has been spectacular. One may wonder whether it is sustainable.
What does it actually mean that the stock market is “too optimistic”? Doesn’t the stock price always reflect the average expectation of all investors? True, and, in this sense, the market cannot be “too optimistic”. On the one hand, the market is always right.
On the other hand, the legendary economist Paul Samuelson famously noticed that the “stock market has predicted nine of the last five recessions”. Stock markets also appear “excessively volatile”, as Shiller showed already in 1981. I.e., the stock market might always be right, but perhaps we are going through a period of excessive volatility where markets were overly pessimistic in March and are overly optimistic now.
In any case, if the stock market is always right, so is the futures market. Investors in the futures market expect huge drops in dividends over the next year. If stock prices behave as they usually do during recessions, stock prices should drop even more, that is dropping even more than dividends.
Market developments
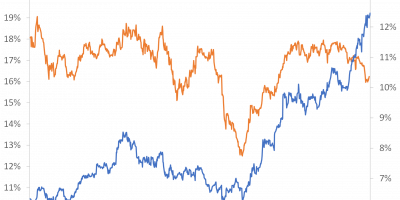
Before we start this attempt to explain things and look ahead, let us review the facts. This graph shows developments in the Danish, the US, the world (MSCI All countries), and the emerging stock markets since the start of the year, all MSCI indices (Danish index is in Danish kroner, the rest in USD):

Data source: Theomson Reuter Datastream via Eikon.
Stock markets did well in the beginning of the year, fell dramatically from mid-February through mid-March, and have rebounded spectacularly since then. Today, the Danish stock market is above its January 1 value, the US market is 10% down, the world market is 15% down, and emerging markets are 20% down.
What could explain current stock prices?
Stock prices are by definition discounted future cash-flows. That is easy to say. The difficult part is to find the expected future cash-flows and the appropriate discount rate.
Let us start with a positive view on markets and see what is needed to support this.
To begin with, let us keep the discount rate fixed. Let us also, as a starter, assume that valuation ratios are constant. For instance, let us assume that stock prices closely follow developments in real economic activity. Under these assumptions, we would, largely, be able to understand recent market movements. These assumptions would also support a rosy view of the future. Afterwards, we discuss if this is a likely scenario.
Forecasts for economic activity in light of the corona crisis start coming in. Late April, we got the WEO from the IMF and forecasts for the US from the CBO, and this week we got forecasts for Europe from the EU-commission. This figure shows the expected path of real GDP in the US and EU:

Data source: EU commission and CBO.
This recession is enormous. GDP is expected to fall by 15% in Q2 this year, compared to late 2019. Luckily, economies are expected to rebound sharply after this quarter, too. The EU commission expects a strong recovery in the EU in 2021, with 6.1% growth in 2021. The CBO expects 2.8% growth in 2021 in the US. Whether this difference is realistic, I do not want to discuss here.
The economy drops by 15% in Q2. If stock prices follow GDP, as we assume for now, stock prices should have dropped by 15% in Q2. This is almost spot-on.
This theory would also predict that we have a great year in front of us. Economic activity should improve by something like 15-20% until late 2021. If stock prices follow, stock prices should also increase with something like 15-20% from here.
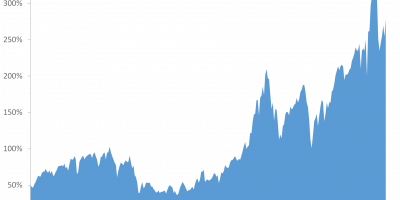
What about the huge drop in March? This we can also explain, I think. Basically, it had little to do with underlying economic fundamentals. Some leveraged hedge funds got squeezed, they received margin calls, they dumped everything to raise cash, there was panic, spreads widened, and markets feared a replay of 2008 (I comment on it here and John Cochrane has a nice and more detailed explanation here). Stress on markets almost reached 2008 levels, as, for instance, the St. Louis Fed Financial Stress index indicates:

Data source: St. Louis Fed.
Central banks intervened and provided liquidity. Markets calmed down. The stress index is still somewhat elevated, but much lower than in March. Markets started looking at economic fundamentals again. With lots of liquidity around, and low yields, investors bought stocks. This was a temporary crash.
The intermediate conclusion is that if stock prices follow GDP, stock prices should drop by something like 15% during Q2, only to rebound afterwards. And, as of today, stock prices have in fact fallen by something like 15% since the start of the year, with a bumper on the road in March. If we stop here, everything would be fine and we should expect substantial stock market gains going forward. Under these assumptions, markets are expected to rebound by something like 15-20% until late 2021.
Cash-flows do not always follow economic activity
Unfortunately, we cannot stop here. We need to go back to the definition of stock prices: Discounted cash-flows. I truly believe that cash-flows relate to economic activity in the long run (I have research demonstrating this), but I also believe that there are temporary business-cycle deviations between cash-flows and economic activity. And these deviations can be substantial.
We have expectations to economic activity from IMF, CBO, EU, and so on, but how do we find expectations to cash-flows? Niels Joachim Gormsen from the University of Chicago, a smart former Ph.D. student at Copenhagen Business School, has, together with Chicago Professor Ralph Koijen, developed a method that can be used to back out expected changes in dividends from dividend futures. They also estimate a relation between dividend growth and GDP growth, such that they can back out expected GDP growth, too.
Their latest estimates are from April 20. Compared to January 1, 2020, Gormsen and Koijen estimate that US GDP will be 3.8% lower over the next year (precisely, Niels tells me, they compare expected growth from April 1, 2020 through April 1, 2021, to expected growth from January 1, 2020 through January 1, 2021). This is not far from what the CBO expects (the figure above shows that GDP will be something like 5% lower ultimo 2020 compared to primo 2020).
The scary thing is that Gormsen and Koijen show that markets expect dividends to be 18% lower over the next 12 months, i.e. drop by 13%-points more than GDP. An 18% drop in dividends is a very large drop in historical terms.
This graph shows how investors update their expectations to future dividend growth rates during the corona crisis:

For the EU, Gormsen and Koijen expect GDP, respectively dividends, to drop by 6.3%, respectively 28%. The market is always right, right?
Unfortunately, we cannot stop here either.
Stock prices react excessively to cash-flows during recessions
We need to talk about the last part of the definition of stock prices: discount rates. Research shows that discount rates move counter-cyclically, increasing in bad times and dropping in good. From our definition of stock prices, this means that stock prices should fall by more than dividends in bad times, if discount rates increase in bad times.
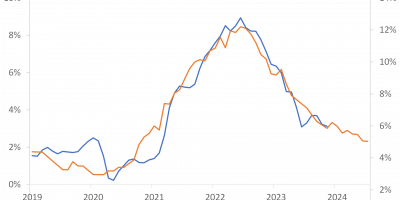
Tim Kroencke from the Univeristy of Neuchatel has an interesting paper that studies how stock prices move in relation to dividends during recessions. The central graph in the paper is this one:

The graphs shows how dividends (and earnings) fall during recessions and how stock prices fall even more (there are two stock price indices. Read Tim’s paper to get the explanation for the difference. The point is that stock prices fall more than dividends.)
The figure shows that US dividends drop by 10% and US stock prices drop by ten percentage-points more, i.e. 20%, on average during US recessions. It also shows that stock prices do not drop ahead of the drop in dividends, but alongside. This is not good news.
Gormsen and Koijen’s estimates say that we should expect dividends to drop by 18% for the US and 28% for the EU over the next year. Kroencke says that on average stock prices drop by 10%-points more. This means that stock prices should drop by close to 30% in the US. If we use the 10% drop in the price-dividend ratio for EU data, EU stock prices should drop by close to 40%. Today, stock prices are down 15% globally.
Conclusion
We might hope that this recession plays out in a different way than recessions usually do. We might also hope that stock markets react in a different way than they usually do. We might hope that everybody starts spending when economies open up, companies start producing, and earnings and dividends do not suffer. In this case, the drop in dividends might not be that large. And, we might hope that stock markets do not fall by more than dividends, in contrast to what they normally do. This could for instance be because central banks are marginal investors in many markets now, driving asset prices away from what they would have been if prices were solely determined by private market participants. This is what markets hope. And, of course, this might turn out to be the case.
We might also fear, however, that companies will start facing problems given the severity of the crisis, i.e. this turns from a liquidity crisis to a solvency crisis. Should this happen, earnings and dividends will drop. The market is always right. The futures market expects dividends to drop by something like 20% for the US and 30% for Europe. If stock prices react as they normally do during recessions, stock prices should drop even more. The 15% drop since early 2020 seems small in this light.
———————————————————————————-
PS. Did you by the way notice the German Constitutional Court ruling this week? Given last week’s post on the Italian situation, I might just inform you that the Italian yield spread to Germany widened as a consequence. Not a lot – 15 basis points or so – but in the wrong direction.