This corona recession started in February 2020. Officially, it is still ongoing. But, perhaps, it has in fact already ended. This might seem confusing but it helps explaining the performance of financial markets during this “recession”.
In my soon-to-be-released book From Main Street to Wall Street (link and link), I – among many other things – carefully examine the historical relation between the business cycle and financial markets. I verify that stock markets typically perform considerably better during expansions than recessions. In the book, I examine and explain why this is so. I also explain that this is not a bulletproof finding. It is not always so. Sometimes stock markets do fine during recessions. Is this recession one of them?
This recession
In the US, the Business Cycle Dating Committee (link) determines peaks and troughs in US economic activity. On June 8, 2020, the Committee announced that:
“The committee has determined that a peak in monthly economic activity occurred in the US economy in February 2020. The peak marks the end of the expansion that began in June 2009 and the beginning of a recession. The expansion lasted 128 months, the longest in the history of US business cycles dating back to 1854.”
This means that this recession started sometime in February 2020. It also means that the expansion preceding this recession became the longest on record.
The Committee has not declared the end of this recession yet. Officially, the US economy is still contracting, with the caveat that the Committee determines business-cycle turning points with a lag. E.g., it was in June only that the Committee concluded that the recession had started in February.
How has the stock market performed during this recession? As readers of this blog know, it has performed well since March 23 when the Fed had is “Whatever it takes moment” (link). During this recession, the US stock market has returned 10% up until today (total return on the MSCI USA index). This is particularly noteworthy in light of the fact that this recession has been unusually severe (link and link).
Perhaps the recession ended in April
This corona recession is special. Usually, recessions are caused by some economic imbalances that need to be corrected, such as an overvalued housing market or an implosion of the financial sector. This is not the case here. This recession was caused by the sudden arrival of a virus. The sudden arrival of the corona virus caused a sudden shutdown of economic activity.
The Business Cycle Dating Committee has traditionally relied on aggregate economic data when determining turnings points in the business cycle. Aggregate data, such as industrial production, GDP, etc., are available at the monthly or quarterly frequency. Given the underlying cause of this recession, which led to the closure of business activities from one day to the next, we need to look at higher-frequency data when searching for turnings points in economic activity.
One interesting new higher-frequency indicator is the Weekly Economic Index developed by the New York Fed (link). It summarizes information in ten weekly indicators of real economic activity. It is designed to track the four-quarter growth rate of real GDP. As the St. Louis Fed notices (link) ”This series is potentially a useful indicator to watch because James Stock (one of the authors of the study developing the index) is a member of the BCDC (Business Cycle Dating Committee).”
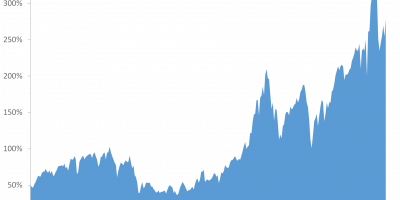
The interpretation of the index is that it is “scaled to the four-quarter GDP growth rate; for example, if the WEI reads -2 percent and the current level of the WEI persists for an entire quarter, one would expect, on average, GDP that quarter to be 2 percent lower than a year previously.” The Weekly Economic Index is available since January 2008:

Source: Fed St. Louis Database.
The index tracks the financial crisis well. In particular, as the figure shows, it bottoms out in Q2 2009 when the recession ended.
The indicator also tracks the beginning of this recession well. It fell like a stone from a rock when the recession started in February.
The interesting point here is that the indicator reaches its bottom during the last week of April 2020. I.e., if a recession ends when this indicator bottoms out, as in 2009, this recession ended in late April.
The idea that this recession ended in late April would also be consistent with the observation that US real GDP dropped dramatically from the first to the second quarter of 2020, and rebounded strongly from the second to the third quarter:

Source: Fed St. Louis Database
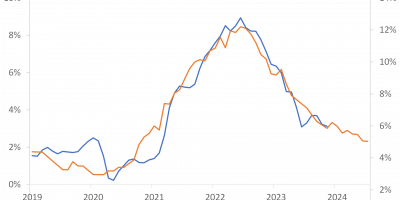
What about international evidence? I am not aware of a well-designed index that tracks, e.g., Eurozone economic activity at the weekly frequency. So, as an alternative when looking at data from other countries than the US, let us consider industrial production. Industrial production is a traditional business-cycle indicator. It is available at the monthly frequency:

Source: Fed St. Louis Database and Thomson Reuter Datastream via Eikon.
For the US, industrial production bottomed out in April, like for the weekly indicator above. The collapse in Eurozone industrial production is much larger than in the US, but the timing is the same. Also for the Eurozone, industrial production bottoms out in April. So, perhaps this recession really ended in April.
The stock market and the recession
Typically, stock markets tank during the early phase of a recession, and starts rebounding when the end of the recession is in sight, i.e. before the actual end of the recession. Furthermore, the stock market normally does well during the early phases of expansions.
This graph splits the cumulative return on the US stock market into a mid-February (start of recession) to late April (assumed end of recession) period, in red, and a period thereafter, in green:

Source: Thomson Reuter Datastream via Eikon.
If we decide that this recession ended in late April, instead of assuming that the recession is still ongoing, the behavior of the stock market makes perfect sense. In this case, the stock market lost 14% during the recession. Since May, i.e. since the assumed end of the recession, the stock market has gained 27%.
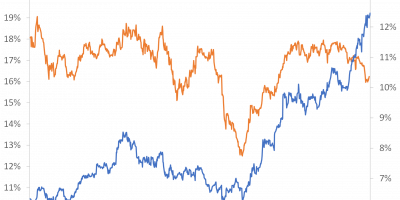
Zooming in on the correlation between the Weekly Economic Indicator and the cumulative return on the US stock market, it follows that the stock market bottomed out before economic indicators started improving. This again emphasizes that the reason for the turnaround in the stock market in March was the “Whatever it takes moment of the Fed on March 23” (link). Since late April, however, the stock market and economic conditions have moved in tandem, i.e. economic conditions have improved and so has the stock market:

Source: Fed St. Louis Database and Thomson Reuter Datastream via Eikon.
Did the recession really end in April, then?
We do not know. It is, as mentioned, the NBER Business Cycle Dating Committee that determines peaks and troughs in the US economy. They have not called the end of the recession yet. Hence, officially, the US economy is still contracting.
I am happy that I am not a member of the NBER Business Cycle Dating Committee. This time, it must be particularly difficult to decide whether the US economy (as well as the European economy, by the way) is really out of the recession or not. As we all know, numbers of new cases are on the rise again in the US and have been doing so for a while in Europe. This will hurt economic activity going forward. So, should one conclude that there was a recession from February through April, or should one conclude that the recession is still ongoing. This is no easy question.
VV (two single Vs) or W?
Did the recession start in February and stop in April? Are we now entering a new recession due to a rising number of corona cases and a subsequent slowdown in economic activity? Or, are we still in the recession that started in February? One way to try to judge this is via NowCasts, i.e. daily forecasts of what growth in economic activity will be the current quarter. This is related to, but different from, the Weekly Index above. It is an estimate of the growth rate of GDP during the current quarter, but based upon data available at a higher frequency. Here is the NowCast from the New York Fed:

Source: New York Fed
It has a clear V-shape during the second quarter. During April/May/June, incoming data indicated that the fall in GDP during Q2 would be enormous, as it turned out to be (see figure above with actual GDP growth). Incoming data during Q3 indicated that Q3 growth would be high, as it turned out to be. Q4 growth is expected to be considerably lower than Q3 growth, i.e. a new V, but growth is still expected to be positive.
Why is it important whether the recession lasted from February through April only (one V), whether we left the recession in April/May but enter a new now (two Vs, i.e. VV), or whether we are still in the recession, but economic growth was high during Q3 but expected to be low during Q4 and possibly Q1 2021, i.e. W? The reason is that it influences how we should think of recessions and financial markets during recessions.
Conclusion
Historically, stock markets have suffered during recessions. This recession started in February. Since then, the US stock market has gained 10%, seemingly in contrast to its usual behavior during recessions. Economic activity bottomed out in late April, though. The US stock market lost 14% from February through April. Since then, it has returned more than 25%. So, whether you conclude that the stock market has suffered during this recession or not depends on your favorite definition of when the recession ended, if at all until today.
To get the official answer, we have to wait for the NBER Business Cycle Dating Committee.
For the future path of the stock market, the question will be how the number of new infections develop and their impact on economic activity.
For the history books, i.e. for the conclusion of whether the stock market performed surprisingly well during this recession or not, the question is whether the recession ended in April or hasn’t ended yet. Did we have one V from February through April, do we get a new V now, so this ends up being VV, or are we still in the recession, i.e. W?