In this final post dealing with my book From Main Street to Wall Street, I describe how one can use insights gained from its initial parts to make predictions about the future. Along the way, I discuss how likely it is that we are heading for a recession (the likelihood is low) and why we should expect low returns going forward. I also give you my best guess of the expected real return from US stocks. This is low, too.
Knowledge about the theory of and historical relation between economic activity and financial returns is useful when dealing with the outlook for financial markets. This is how I have structured my book. I first describe the long-run historical relation between economic growth and returns, then the business-cycle relation, and finally how we can use these when making predictions about future returns. I have described the business-cycle and the long-run relations in previous posts (link and link). This post deals with expected returns.
Let me start with a cautioning remark: It is easy to misunderstand what we mean by “expected returns” or “forecasting returns”.
People have this tendency to say “if you can forecast the stock market, why aren’t you rich?” You might say so, but it is beside the point. Or, at least, beside the point I want to make.
I believe the aggregate stock market is reasonably efficient. We might see inefficient trades, for instance among individual investors, but in aggregate, they cancel out (to a large extent). In such a world, where the average investor is reasonably efficient, how can returns be somewhat predictable? Here is one story. If unemployment is high today, people on average tend to be more cautious with their money, and thus less likely to invest in risky stocks. We say that risk aversion is high during recessions. When people are reluctant to buy stocks, stock prices fall. Given a certain path of expected future dividends, a low stock price today means a higher expected return. This is predictability. Can you make money on this? Yes, but you must then differ from the rest. To make money in this example, you need to buy stocks when everybody else is shying away from the stock market. This is fine, but you then differ from the average. And we cannot all differ from the average! Then it would be a different average. So, for instance, if aggregate risk aversion goes up during recessions, aggregate stock returns will be somewhat predictable. Everybody can see this predictability, but we cannot all profit from it, because we cannot all differ from the average. The example here is basically the habit-formation model of Campbell & Cochrane (1999). I discuss this and related literature in the book.
People also sometimes misunderstand what we mean by predictability. To be clear, there is a lot of uncertainty out there and consequently a lot of uncertainty surrounding our forecasts. Hence, we will often get it wrong. People start saying things like “With all this uncertainty, if the average stock return has been 6% in real terms historically, this will probably also be the best guess of future returns”. I disagree. I think there are good reasons to believe that expected returns move over time, as mentioned above. So, it is seldom that we hit it spot-on, but if you get it right more than fifty percent of the time (in systematic ways), it matters.
Short horizon
It matters whether we talk about expected returns over the next couple of months, the next couple of years, or the next couple of decades. I structure my discussion around this.
I have very little to say about expected returns over very short horizons, such as a few days or weeks. This book is about the relation between economic activity and returns. Over very short horizons, there is almost no detectable relation here.
It is not that we can’t say anything at all. For instance, I discuss research arguing that stock returns react immediately to changes in monetary policy. There is evidence that stock prices fall when monetary policy is tightened. There is also evidence that returns react to releases of news about the macroeconomy. For instance, when new figures for employment or economic output are released, expected returns change. But I believe most investors would be better off focusing on the big picture and forgetting about daily fluctuations.
When we talk about returns over slightly longer periods, such as a year or a couple of years, we should be able to say something. I demonstrate in my book that stock markets generally do poorly during recessions and greatly during expansions. So, if we can say something about the turn of the business cycle, this should tell us something about future returns. If we believe a recession is approaching, we might lower expected returns.
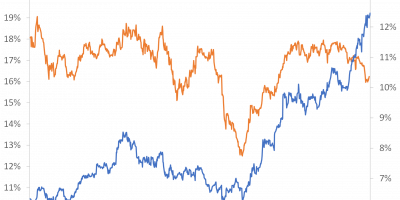
I mentioned in my previous post (link) that the yield curve tends to flatten before recessions, i.e. the slope of the yield curve is a reasonable predictor of the business cycle. Putting it into a regression model, we can turn the slope of the yield curve into a recession probability. The New York Fed has worked on this, and produce their monthly recession probabilities. The only input is the yield curve. The model measures the probability on a monthly basis that the US economy will contract twelve months ahead. In other words, given the slope of the yield curve today, what is the likelihood that the US economy will be in recession twelve months ahead. It is in Figure 1, together with shaded areas of recessions.

Source: New York Fed.
The slope of the yield curve is probably the best recession indicator out there. There is a tendency that the slope of the yield curve changes in systematic ways prior to recessions. Probabilities of recessions start to rise before recessions actually occur. So, the slope of the yield curve says something about expected returns.
What do the actual data tell us? Currently, this model tells us that there is a 6% chance only that the US economy will be in recession in May 2022. The likelihood of a recession is low.
This corona recession was caused by something completely unpredictable, that is a pandemic. It is nevertheless interesting that the term spread flattened before corona arrived, indicating an increasing probability of a recession prior to the fact. Hence, even without corona (a counterfactual), there were last spring indications of worse times ahead.
In the book, I discuss other recession indicators, such as composite leading indicators, consumer sentiments, surveys of professional forecasters, and many others. I also look at the international evidence. The conclusion is that even when there is a lot of uncertainty out there, several indicators are related to recessions. And recessions, as we know, are bad for stock markets.
I should stress that I am not an advocator of strong market timing, i.e. selling all your stocks because the term structure flattens. But if you are a smart investor, I do believe that it makes sense to take these changing recession probabilities into account when making your asset allocation decisions.
Forecasts for the next decade
When it comes to forecasting stock returns over several years, e.g., over a decade, mean-reversion is a powerful concept. There is a tendency, as also described in my post on the long-run relation between economic activity and stock markets, that – in the longer run – stock prices and underlying fundamentals follow each other (link). In the long run, stock prices tend to grow alongside economic activity, dividends of firms, earnings, and so on. This is important when we talk about return predictability. It implies that if stock prices have grown relatively fast (in relation to their fundamental value) for some time, future price growth should be lower, causing lower returns.
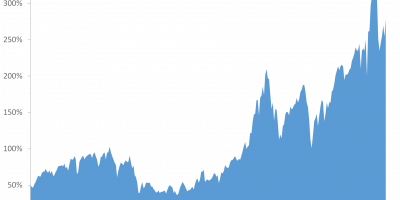
There is this graph (Figure 2), originally invented by Shiller in a classical 1981 article (link), that shows how the current stock price (SP500) throughout history has fluctuated around its fundamental rational price, in this case discounted dividends.

Source: © From Main Street to Wall Street.
The figure reveals a strong case for mean reversion. The fundamental stock price grows over time, because economic activity and dividends grow over time. The actual stock price follows this, but with considerable fluctuations around the long-term growth trend. Shiller used this to say that stock prices are ‘excessively volatile’. I would like to highlight another implication. Following strong grow in actual stock prices, their growth rate slows down. And vice versa. Stock prices seem to revert to their slow-moving low-term growth trend. Stock prices seem to be somewhat predictable.
In subsequent academic research, academics have evaluated exactly how predictable stock prices are. Typically, future stock prices are predicted by a valuation ratio, i.e. by the current level of stock prices relative to a ‘fundamental’ determinant of stock prices. For instance, if current stock prices are high relative to the underlying earnings of firms, expect stock prices to come down. There is a very large academic literature on this. Academics have studied this for different time periods, different asset classes, different countries, and so on. It seems to work. There is uncertainty, but there are identifiable relations and they matter.
Today’s estimate
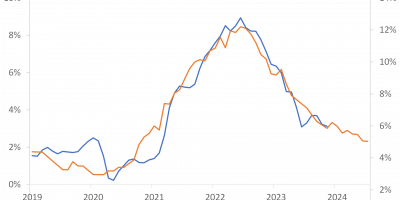
In the book, I describe the literature, its results, how it works, and so on. Let me give one example here. I take a famous one. The Cyclically-Adjusted Price Earnings ratio (CAPE) of Robert Shiller takes the real value of the SP500 and scales it by the average of real earnings over the preceding 10 years. Historically, this has tracked expected returns reasonably well, as I show and discuss in the book. I will give it a little twist here. I invert it and take logs, such that it becomes a yield. It is in Figure 3.

Source: © From Main Street to Wall Street.
Each observation in the graph is an estimate of the expected annual real return from US large-cap stocks over the subsequent decade. Hence, the last observation in the graph is today’s estimate. This models predicts that the real annual return from US large-cap equities will be around 3% per year over the next decade.
I add a dotted line, showing where we are today, such that we can compare today’s expectations to previous expectations. Except from the peak of the Dot-Com bubble, expected returns have never been as low as they are today.
Shiller’s CAPE is nice. In my book, I argue, though, that one will benefit from taking economic activity into account. I develop a model that incorporates information from CAPE and real economic activity. Given that economic activity has been depressed during 2020 because of the pandemic, but the stock market has sprinted ahead, this indicates an even higher valuation of the stock market today. With mean reversion, a higher valuation today indicates even lower returns going forward. In fact, this model indicates almost no return (in real terms) from the US stock market over the next ten years. This deserves a separate blog post. In total, there are good reasons to believe that returns will be low, at least from the US stock market, over the next decade.
Forecasts for several decades
What if your forecasting horizon is longer than a decade? This is relevant for, e.g., a 30-year old saving for retirement. If this person saves USD 1 today, how much will this help increasing retirement income? The 30-year old might expect to retire at age 70, i.e. in four decades. To find the value of this person’s pension wealth during retirement, we need estimates of expected returns over the next several decades.
Is it possible at all to formulate expectations to returns, say, 40 years out? If we want to help this person making informed decisions, we have to.
In the book, I discuss a number of procedures one might use when thinking about long-term returns. What matters here are expectations to long-term economic growth rates and long-term savings and investment relationships. I will not go into this here. Read the book if you want to know.
What I can add, though, is a link to an exciting conference I organize in September on the long-run outlook for interest rates and returns (link). At the conference, we will discuss these issues thoroughly. If you are in Copenhagen, and agree that this is an important and interesting topic, you are more than welcome.
Conclusion
Fifty years ago, people believed that stock prices follow a random walk, i.e. move around in unpredictable ways. Today, an abundance of academic and industry research has confirmed that returns contain a predictable component. It is small on the short horizon, and is surrounded by uncertainty, but is nevertheless of importance to investors and academics.
Return predictability is a fascinating topic for people interested in financial markets. After 40 years of falling interest rates, and more than ten years of booming stock markets, many asset prices seem stretched. We should expect low returns going forward. This is no fun, but nevertheless important to recognize for people planning for the future.