Today’s situation shares many similarities with the situation in the 1970s: Sky-high inflation, war, insufficient tightening of monetary policy, uncertainty about the economic outlook, and more. Countries responded differently to the events back then, though. I analyse the reactions of the German and U.S. central banks and emphasize lessons relevant for today. My next analysis will examine what current monetary policy can learn from those experiences.
In many ways today’s situation resembles the situation in the 1970s:
- Inflation is very high. It was then and it is now. Both overall inflation, which includes energy and food prices, and core inflation, which excludes energy and food prices, are too high.
- There is war, then and now. It’s terrible. For the economy, it creates uncertainty and increases energy prices even further.
- Central banks tighten monetary policy, then and now. Rates rise.
- Economic activity slows down. In the 1970s, economies contracted. The question today is whether we are heading for a recession (link).
Given the similarities between then and now, it is useful to recall the most important lessons from the 1970s.
One important lesson was that Germany was able to maintain a relatively low and stable rate of inflation, lower than in most other countries. Another lesson was that the U.S. had to tighten monetary policy draconically in the early 1980s to bring very high U.S. inflation under control, eventually causing a severe recession. Why these differences between Germany and the U.S.?
Former ECB Chief Economist and Bundesbank board member Otmar Issing (link) recently stated it bluntly:
“The Bundesbank tried to control inflation and the consequence was moderate inflation and a mild recession,” said Issing, who joined the German central bank in 1990. But “the Fed waited too long” and the US had “double-digit inflation and a deep, deep recession”.
Was the German Bundesbank really so much more aggressive (than the Fed) during the 1970s? And did the German economy really perform so much better? Let us take a closer look.
The situation in the 1970s
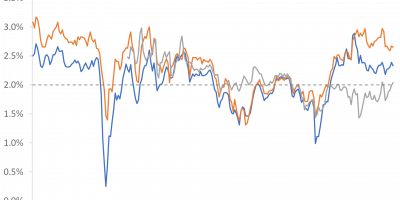
Figure 1 shows German and U.S. inflation from 1970 to 1985.

Data source: Bundesbank and Fed St. Louis Database.
Inflation in both Germany and the U.S. increased during the early and the late 1970s, but inflation rose much more in the U.S.
U.S. inflation rose from 2% to 12% during the early 1970s, while German inflation rose from 2% to 8%. A ten percentage points increase in the U.S. compared to a six percentage points increase in Germany.
During the late 1970s, inflation rose from 6% to 14% in the U.S., while it went from 2% to 6% in Germany. I.e., an eight percentage points increase in the U.S. and a four percentage points increase in Germany.
Furthermore, Germany managed to get inflation down to 2% during the mid-1970s, before inflation started rising again in the late 1970s, while the U.S. only managed to get inflation down to 6%.
Overall, over the 1970-1985 period, inflation averaged 7.2% in the U.S. and 4.8% in Germany. Inflation was also more stable in Germany. The standard deviation of German inflation was 1.6% (over the 1970-1985 period) while the standard deviation of U.S. inflation was 3.2%. No doubt, Germany fared better.
Monetary policy: Policy rates and real rates
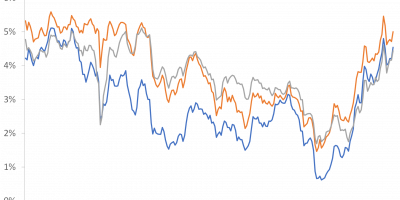
Was German inflation lower and more stable because German monetary policy was tighter? Figure 2 compares U.S. and German monetary policy rates (perhaps you have forgotten, but the monetary policy rate of the Bundesbank was the so-called ‘Lombard rate’ (link). There was also the ‘Discount rate’ but for simplicity, I only show the Lombard rate here).

Data source: Bundesbank and Fed St. Louis Databases.
It is relevant to distinguish between the experiences of the early and the late 1970s. The Bundesbank did not do well doing the early 1970s, but they quickly learned. During the mid- and late-1970s, the Bundesbank did much better.
During 1970-1972, the Bundesbank lowered policy rates while inflation was increasing (see Figure 1 for the rise in inflation during 1970-1972). Lowering interest rates when inflation is rising is counterproductive monetary policy. This was not good, and German inflation only increased.
In 1972 both the Fed and the Bundesbank started raising rates. The increases in monetary policy rates following the 1972 oil price shock were of similar magnitudes in Germany and the U.S. During the first half of the 1970s German and U.S. policy rates moved in tandem (Figure 2).
Turning to the late 1970s the Fed started raising rates in 1977. After the 1979 oil price shock U.S. monetary policy rates rose even further, reaching 16% in 1980. U.S. rates were briefly lowered in 1980, only to be raised again soon thereafter, to almost 20%. Rates remained at more than 15% for a year. German policy rates also rose during the late 1970s, reaching 12%.
Inflation was much higher in the U.S. during the late 1970s, though (Figure 1). This means that monetary policy rates should be raised more in the U.S. to obtain the same impact on economic activity and inflation. In order to judge the stance of monetary policy, we thus need to look at real rates. Figure 3 shows real rates in Germany and the U.S., calculated as the monetary policy rates of Figure 2 minus the inflation rates of Figure 1.

Data source: Bundesbank and Fed St. Louis Database.
In 1971-73 German real rates were lower than U.S. real rates. Monetary policy in Germany was too loose and stimulated inflation.
After the collapse of the Bretton Woods system in 1973, however, Bundesbank was freed from its obligation to intervene in FX markets. It could instead directly address inflation (link). Bundesbank raised monetary policy rates, thereby pushing up real rates, and kept real rates higher than in the U.S., in particular after 1974. While real rates were negative in the U.S. during the mid-1970s, real rates were positive in Germany. Tighter German monetary policy pushed down German inflation during the mid-1970s. Similarly, the rise in real rates from 1979 to 1981 (following the 1979 oil price shock) was also more consistent in Germany, helping to keep German inflation under control during the late 1970s and early 1980s.
Figure 3 also includes dotted lines showing average real rates in Germany and the U.S. over the 1974-1981 and 1981-1985 periods, respectively. Real rates were on average 2%-points higher in Germany during the 1974-1981 period.
It thus seems that the Bundesbank failed during the first years of the 1970s, potentially because of its commitment to the Bretton Woods system, but changed its reaction function after 1972-73. During the remainder of the 1970s and the early 1980s, Bundesbank kept real rates higher than did the Fed. As a result, German inflation was lower.
In the early 1980s, the Fed draconically tightened monetary policy. It kept real rates at elevated levels during the early 1980s in order to bring sky-high inflation under control. During the 1981-1985 period, US real rates averaged 6%, while German real rates were closer to 3%, Figure 3 shows.
The conclusion seems to be that the Bundesbank – subsequent to its mistakes in the early 1970s – did better during the mid- and late 1970s, maintaining higher real rates than in the U.S. and, as a result, lower inflation. Also, the German reaction to the 1979 oil price shock was more decisive. The Fed only started seriously combating inflation in 1981. U.S. real rates had to be kept at elevated levels during the first half of the 1980s to bring inflation under control.
Consequences for economic activity
What were the consequences of these policy choices and trade-offs for economic activity?
Figure 4 shows U.S. and German real GDP. One has to stare very closely at the figure to spot any differences before 1983.

Data source: Bundesbank and Fed St. Louis Database.
Germany traded off somewhat higher real rates for lower inflation during the mid-1970s, as mentioned. The U.S. traded off lower real rates for higher inflation. In spite of these large and important differences GDP developments were roughly identical, however. It thus seems that Germany did not pay a price (in terms of foregone economic activity) for its higher real rates in the mid-1970s and the U.S. did not pay a price for its higher inflation. Alternatively, Germany did not gain (in terms of higher economic growth) from its lower inflation.
What about the post-1980 situation? During the early 1980s, the Fed kept real rates at very high levels, eventually leading to a sharp fall in inflation. High real rates also caused severe recessions in the U.S., though. Result: The U.S. economy did not grow at all from 1980 to 1983.
Germany, however, did not experience any economic growth either. German real GDP was in 1983 at the same level as in 1980.
The U.S. recessions of the early 1980s were deep. Cumulatively, during the 1980 and the 1981 recessions, U.S. real GDP fell by 5%. Growth during the expansion between the two recessions implied, however, that in 1983, U.S. GDP was back at its 1980 level. In spite of very different monetary policies, overall economic developments were thus broadly similar in Germany and the U.S. during the early 1980s.
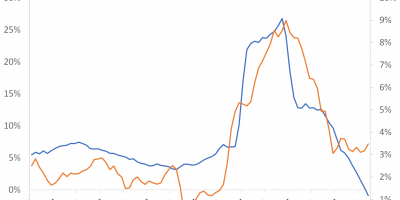
Unemployment tells a somewhat similar story, Figure 5 shows.

Data source: Fed St. Louis Database.
U.S. unemployment was consistently higher than German unemployment during the 1970s and 1980s. The jumps in unemployment during 1973-1974 and the early 1980s were more or less similar, however. In other words, even if the Fed had to tighten monetary policy draconically in the early 1980s, the rise in U.S. unemployment was not larger than the rise in German unemployment. Unemployment went from 6% to 11% (from 1980 to 1983) in the U.S., an increase of five percentage points. In Germany unemployment increased from 3% to 8%, also a five percentage points increase.
A five percentage points increase in unemployment is terrible. The point here is that the situation was equally bad in the U.S. and Germany. My conclusion that economic performance in Germany was not superior to that of the U.S., in spite of lower and more stable inflation, is shared by other academics (link). Alternatively, one might say that unemployment doubled in the U.S., while it almost tripled in Germany. There are thus people arguing that “West Germany’s success in controlling inflation has perhaps come at the expense of persistently high unemployment” (link).
Conclusion
Inflation was generally very high in the 1970s, though some countries performed relatively better. For instance, inflation in Germany was below 5% on average over the 1970-1985 period, while it was above 7% on average in the U.S. Inflation was also more stable in Germany.
I have argued that the Bundesbank – after its mistakes in the very early 1970s, 1970-1972 – was tougher on inflation than was the Fed. Bundesbank raised nominal rates above inflation rates, i.e. kept real rates higher during the mid-1970s. I have also argued that even when the Fed had to tightened monetary policy draconically in the early 1980s to bring inflation under control, and caused a severe recession as a result, Germany did not perform better in terms of economic activity.
In my next analysis (link), I will examine what monetary policy today can learn from these experiences.