
You often hear that soaring energy prices, caused by supply-chain disruptions resulting from the pandemic and the war in Ukraine, caused the current inflation flare-up. A negative supply shock raises prices but – it is sometimes forgotten – when supply is restored, prices should fall back. In the data, consumer prices follow oil prices on the way up but not on the way down. This points towards inflation being high primarily because demand is high. Central banks, therefore, must be tough.
John Cochrane used some of the graphs from my previous story in a recent interesting post (link) – read it. He reexamines the demand-vs.-supply debate. I thought it would be fun to follow up and have a closer look.
Sky-high inflation is the main economic challenge these days, and people naturally discuss what caused it. Policymakers, not least in Europe, emphasize factors outside their control, such as high energy prices, resulting from supply-chain disruptions due to the pandemic and the war in Ukraine. The argument extends to other goods whose supply chains were disrupted during the pandemic.
It is correct that higher energy prices push up inflation. However, this does not necessarily mean energy prices are the main drivers of inflation. Perhaps something else – aggregate demand, for instance – simultaneously pushes up both energy prices and inflation. In fact, I, and many other academics, argue that too expansionary policies are the main culprits (link).
Cochrane, in his post, suggests a simple test: “A “supply shock” would raise prices temporarily, and then prices would fall back down to normal once the supply shock is over.”
This is a great point. All else equal, if supply chains are disrupted, prices rise. But, by the very same logic, if this (supply-chain disruptions) is the only thing that happened, prices should fall back when supply-chains are restored. Basically, if there is no energy available today, but I need energy, I must pay more to get it. Energy prices rise, and so does the overall price index because energy prices are part of the overall price index. Inflation goes up. But when the supply of energy is restored and the price of energy falls back, so should inflation, if the energy shock was the underlying driver of inflation.
This is important because it influences how central banks should react. If inflation is high because of a temporary supply shock, central banks should not do a lot. If, on the other hand, inflation is high because underlying demand is high, they should be tough.
I start with the US evidence and then turn to the European. To have a focused discussion, I look at oil prices. I could have discussed gas prices, or the prices of other goods whose supply chains were disrupted during the pandemic. Largely, the conclusion would be the same. Energy prices play a special role, though, because policy makers refer to energy prices, as mentioned, and because they have previously played an important role when it comes to inflation (in the 1970s). Finally, I focus on this inflation period, i.e., the period after the financial crisis in 2008-2009.
US evidence
According to the supply-chain disruption story, prices go up when supply goes down, and inflation rises. After some time, supply is restored, prices fall, and inflation is stabilized.
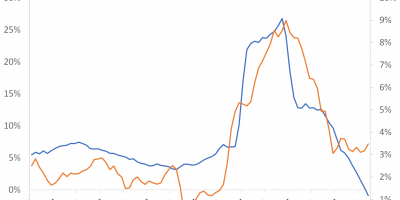
Figure 1 shows the relation between oil prices in the US and US inflation. At first sight, the relation appears impressive. Since the financial crisis, US inflation has closely tracked oil prices. This goes for the period before the pandemic as well as the period after.

Data source: FRED of St. Louis Fed.
Concentrate now on this inflation surge. In spring 2020, when lockdowns were imposed, oil prices tanked and so did inflation. Oil prices even turned negative (on a daily basis, not seen in Figure 1, though, that shows oil prices on a monthly basis, because inflation is a monthly series). Here, I discussed why. Then, following April 2020, oil prices started rising, from negative territory to more than USD 100 per barrel in June 2022. Since June last year, oil prices have been falling. Inflation, as you can see in Figure 1, followed the exact same pattern. Inflation bottomed out in May 2020, peaked in June 2022, and has been falling ever since. You are tempted to conclude that the supply-chain story works.
But hang on. What did John say? “The pure “supply shock” view says that we should now experience a symmetric period of deflation to bring the price level back to where it was, or at least to that plus a 2% trend.”
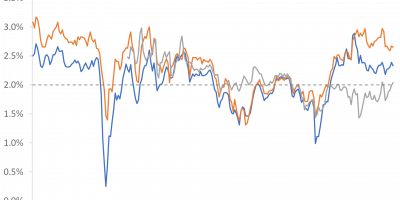
Figure 2 takes a closer look. I calculate the difference between consumer prices and how consumer prices would have developed, had they increased by 2% per year since 2010 when the figure starts. I then relate this (deviations of consumer prices from their 2% trend) to oil prices.

Data source: FRED of St. Louis Fed.
Let us focus on the last couple of months, as this is what we are discussing here, encircled in Figure 2 for ease of reading. Oil prices have been falling by more than 30% since June 2022. If oil prices caused inflation (rises in consumer prices) on the way up, the overall consumer price level should similarly fall back when oil prices fall back. It should be symmetrical. This has not happened. Consumer prices have been flat despite the 30% fall in oil prices.
Unsurprisingly, the story is the same if you look at core consumer prices. This is in Figure 3 (again, the figure shows deviations of core prices from their 2% trend). For core prices, there is no relation before the pandemic. Starting in 2021, core price rose alongside oil prices. However, core prices have remained flat since June 2022 despite oil prices falling by some 30%. If looking at US gas prices, the story is the same.

Data source: FRED of St. Louis Fed.
OK, the reader might say, but how should we explain the strong correlation between oil prices and consumer prices/inflation during 2020 and 2021? First, remember again that inflation naturally trends upwards when oil prices increase, because oil consumption is part of total consumption, thus influencing the consumer price index. This, however, does not mean oil prices cause inflation. Many things happened after the pandemic broke out in spring 2020. Monetary policy turned extremely expansionary, fiscal policy did so too, the economy opened again, and so on. Basically, economic growth and demand kicked in. This led to inflation (link).
Does this mean supply-chain disruptions did not play any role? This is not what I am saying. Supply-chains were disrupted, worsening things and contributing to inflation. Here is a paper that decomposes inflation into demand and supply shocks (link). It finds that supply shocks account for half of this inflation surge. There is debate. Here (link) is a more recent paper that finds supply shocks account for a third at most (this paper finds demand shocks account for two-thirds, meaning supply shocks can account for the remaining third at most).
The point is that it is difficult to identify – disentangle – supply and demand effects when both energy prices and overall consumer prices rise at the same time. Does one drive the other or are they both driven by a different underlying factor? Such identification is possible when energy and consumer prices deviate, as they have done recently. This deviation lends credence to the demand story.
Evidence from the euro area
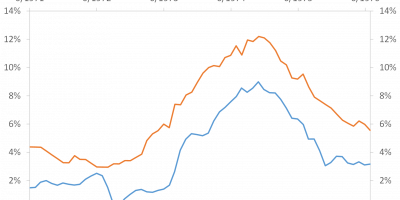
Headline inflation and oil prices are correlated in the euro area too, Figure 4 finds. European inflation followed oil prices on the way up, and inflation now follows oil prices on the way down. The turning point in inflation was a little delayed, though. While inflation in the US started falling in June 2022, Figure 1 showed, the same month oil prices peaked, inflation in Europe peaked in October, i.e., a few months later.

Data source: FRED of St. Louis Fed.
What about the consumer price level? Euro area consumer prices have in fact been falling since November 2022, Figure 5 shows. The drop is minor, though. Oil prices have been falling by some 30%. Consumer prices have been falling by 0.4%. If energy-price developments caused inflation to rise from 0% to more than 10%, we should see a stronger negative impact on consumer prices as oil prices fell again.

Data source: FRED of St. Louis Fed.
Oil vs. gas vs. other goods
I have conducted this analysis focusing on oil prices. For the US, the story is the same if I look at US gas prices. For Europe, gas prices have traditionally been decoupled from oil prices. Furthermore, the war in Ukraine had a massive impact on European gas prices.
Gas prices in Europe were stable before the pandemic, typically trading in the euros 10-20 interval (Dutch TTF, euros per megawatt hour). During the pandemic and after Russia’s invasion of Ukraine, gas prices exploded to more than EUR/MWh 300 (in August 2022) but are now back at EUR/MWh ≈ 50. This is lower than before the war in Ukraine.
Another way of saying this: Gas prices traded at EUR/MWh = 57 on December 31, 2022, while it traded at EUR/MWh = 70 on December 31, 2021, i.e., wholesale gas prices have been falling over the past year. Consumer prices, on the other hand, were 9.2% higher in December 2022 than in December 2021.
There is an interesting point here. Energy-price inflation in the euro area Harmonized Consumer Price Index was 25.5% in December, see Table 1. How does this square with gas prices falling from December 2021 to December 2022?
Table 1.

The reason is technical, but perhaps relevant. First, of course, I compare prices on two specific days (December 31 in 2021 and 2022), which is natural because this measures the change in gas prices during 2022. Daily gas prices fluctuate, though. This leads to the second, more important point, that is there are differences between wholesale gas-price inflation and gas-price inflation in the consumer price index. This has to do with the way wholesale gas prices affect the gas prices suppliers pay. If there is a nerdy reader out there who finds this interesting, here is a good explanation (link).
Where does this take us? Gas and other energy prices of course contributed to inflation in Europe. In particular, the explosion in gas prices after Russia’s invasion of Ukraine caused European inflation to rise even further. As I have written earlier, this is not the main reason inflation is high in Europe, however. For instance, inflation is still high in Europe, even when wholesale gas prices have fallen back to where they were before Russia’s invasion. Furthermore, inflation – excluding energy – was higher than 7% in December 2022, see Table 1. I.e., even if eliminating the part of inflation that is due to energy prices, inflation is still very high.
What about the prices of other goods affected by supply-chain disruptions? Figure 6 shows the Global Supply Chain Pressure Index developed by the New York Fed. As you can see, supply-chain pressures are now almost back at pre-pandemic levels. Inflation is still 7% in the US, 9% in Europe, and so on, however, and core inflation 6%. If inflation was primarily caused by temporary supply-chain shocks, inflation should have fallen back to normal. It has not.

Data source: New York Fed.
Conclusion
I examine a simple “test”, suggested by John Cochrane (link), of what caused this inflation surge. If supply-chain disruptions caused inflation, consumer prices should fall back when supply-chains are restored.
Supply chains were disrupted during the pandemic, and inflation rose as oil prices rose. Since June 2022, oil prices have fallen back by some 30. The overall consumer price level has stayed flat, however. The same applies when looking at gas prices in Europe. During the past year, European gas prices have been very volatile but are now back at the same level as before the war in Ukraine. The consumer price index is 9% higher, though, and inflation without energy 7%.
This leads us back to what I wrote last year (link). Inflation is high because demand is high. And demand increased because monetary and fiscal policies were very expansionary during the pandemic and its aftermath.
The reason all this is important is that it matters for monetary policy. If inflation is high because supply chains are temporarily disrupted, central banks do not have to be tough. If, on the other hand, inflation is high because underlying demand pressures are high, central banks must be tough. Given that I mainly subscribe to the demand story, I advise central banks to stay focused.