
Yield, growth, and valuation drive stock returns. Historically, in long-run US data, yield has been most important. This is no longer the case. Since the financial crisis, and in particular during the past couple of years, increasing valuations have been the main drivers of stock returns. Unless there are permanent bubbles in the stock market, valuations cannot continue to increase indefinitely but will eventually revert. Recent stock-market turmoil makes sense in this light.
For some time, I have argued that stock markets have been ripe for a correction (link, link, and link). It seems that this is what we are witnessing now, with the S&P 500 down by close to ten percent since the start of the year. Scrutinizing the underlying drivers of stock returns helps us understand why.
As I explain in my book (link), stock returns can be decomposed into yield, growth, and valuation. This is useful if we want to understand where stock returns come from.
Let me briefly review the decomposition. Stock returns are per definition:
Stock returns
= dividend yield + capital gain.
Moving terms around, this can also be written as:
Stock returns
= yield + growth + valuation + residual,
where the residual is the product of valuation and growth.
This is not an approximation. You do some math, move terms around, and you calculate stock returns as the sum of yield, growth, and valuation, and a small component which we might call the residual. The terms represent:
- Yield is shorthand notation for the dividend yield. If you calculate annual returns, the dividend yield is dividends paid out during the year divided by the stock price at the beginning of the year.
- Growth is shorthand notation for the growth rate of dividends from the previous year to this year (if dealing with annual returns, as I do below).
- Valuation is the change in the price-dividend ratio from last year to this year. If valuation is positive, stocks have become “more expensive” over the past year, i.e. today you have to pay a higher price for one dollar of dividends.
- The residual makes the calculation fit. Technically, it is not a residual, but the product of growth and valuation. I just call it residual in lack of a better terminology.
Essentially, the decomposition splits capital gains into growth and valuation (and the residual). Thereby, the decomposition helps us understand why share prices have changed. If capital gains are positive, the decomposition tells us whether share prices have increased because firms have increased dividend payments (growth), investors are willing to pay more for one dollar of dividends (higher valuation), or a combination of the two.
The decomposition holds for nominal and real returns. When comparing historical episodes with current ones, it is useful to eliminate the effect of inflation. Hence, in what follows, I decompose real stock returns, such that growth means real growth in dividends, etc.
Decomposing US stock returns
Over the past 150 years, from 1871 to 2021 (included), the US stock market has returned 8.4% per year on average in real terms, i.e. after taking account of inflation.
Slightly more than half of this return has been due to dividends, as the average dividend yield over the 1871 to 2021 period has been 4.4% per annum.
Growth has been 2.3% per annum on average, i.e. real dividends have increased by 2.3% per year.
Valuation has been 3% per year on average, i.e. the price-dividend ratio has expanded by 3% per annum.
Finally, the average of the annual products of growth and valuation, what I call the residual, is -1.3%.
We thus have:
Average annual US real stock return
= yield + growth + valuation + residual
= 4.4% + 2.3% + 3% – 1.3% = 8.4%.
We can do such calculations for different periods. The results are in Figure 1.

Data source: http://www.econ.yale.edu/~shiller/
The first column in Figure 1 shows the decomposition of average annual real returns from the US stock market over the past 150 years, from 1871 through 2021. Yield has as mentioned been 4.3% per year on average (blue), growth 2.3% (red), valuation 3% (green), while the residual has subtracted 1.3% per year on average (purple). In total, an average real return of 8.4%.
Yield accounted for the major fraction of returns prior to 1980, as the second column showing the decomposition for the 1871-1980 period illustrates (blue is largest in the second column). Since 1980 (third column in Figure 1), yield has been relatively less important, while the importance of valuation has increased. Since 1980, yield has been 3% per year on average, while valuation has contributed almost 5% per year. As the S&P 500 has returned almost 10% per annum on average since 1980, expansions in the price-dividend ratio (valuation) have accounted for almost half of annual returns since 1980.
Splitting the post-1980 period into shorter periods, the last two columns of Figure 1 show the drivers of stock returns over the period since the financial crisis, i.e. since 2009 (forth column), and over the past three years (last column). Compared to their long-run historical average, stock returns been high since the financial crisis. Since the financial crisis, the S&P 500 has returned 14% per year on average (after inflation). During the past three years, it has returned an even more impressive 18% per year. Compare this to the before-mentioned long-run average of 8.4%.
The driver of these recent high returns has not been yields. The driver has been valuation. The average annual real return over the past three years has been 18%. Valuation has contributed 14%. This means that 75% of returns have been due to expansions in the price-dividend ratio. The reason stock prices have increased is that investors have been willing to pay more for one dollar of dividends, not because dividends have increased.
This is a profound shift in how stock market investors are compensated. Historically, investors have collected dividends. Since the financial crisis, valuation expansions have caused high returns. This is not necessarily good news.
Mean-reversion
In their classical 1988 article (link), John Y. Campbell and Robert J. Shiller showed that if stock returns and dividend growth rates are bounded, meaning that we cannot have an everlasting increase in returns (stock prices can continue increasing forever, but not stock returns), the price-dividend ratio cannot drift without bounds either. We say that if returns and dividend growth rates are stationary time series, the price-dividend ratio will be stationary too. Stationarity means that if something (such as the price-dividend ratio) has increased for some time, it will eventually come down. It will mean revert.
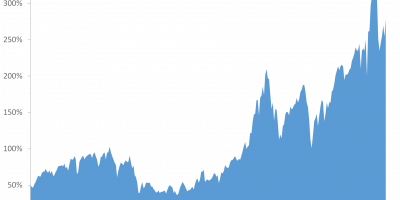
Figure 2 shows the price-dividend ratio since 1871, normalized to “1” in 1871. The price-dividend ratio was basically flat for more than hundred years. Then, it started increasing. Today, the price-dividend ratio is four times higher than it was in 1871. This increase has happened since 1980. Today’s price-dividend ratio is also four times higher than it was in 1980. This has driven returns. The somewhat scary implication is that if one believes the price-dividend ratio is stationary, valuation (the price-dividend ratio) should come down one day.

Data source: http://www.econ.yale.edu/~shiller/
(The attentive reader will perhaps ask “how come that I wrote in the beginning of this analysis that valuation has increased by 3% per year from 1871-1980 when Figure 2 shows that it was more or less the same in 1980 as in 1871”? The answer, that will take us too far afield here, is that the averages in Figure 1 are arithmetic averages. The price-dividend ratio is volatile. Hence, there is a sizable difference between geometric and arithmetic averages. If calculating the geometric average of the growth rate of the price-dividend ratio, this is much closer to zero. This is for another day, though, and does not influence the points made here.).
Forecasts
If one believes that we live in a world without lasting bubbles, which I do, the price-dividend ratio should eventually come down. Does this mean horrible future stock returns?
Mean-reversion in the price-dividend ratio can happen in three ways: Stock prices might fall, dividends might rise, or a combination of the two. Hence, a fall in the price-dividend ratio does not necessarily imply horrible stock returns. If dividends start rising, the price-dividend ratio can contract without causing low returns. Is this what we should expect?
We enter a heated academic debate here. John Cochrane strongly argues that mean reversion in the stock price-dividend ratio results from movements in returns, not movements in dividend growth rates (link). The implication is that a high valuation today forecasts low future returns. Others argue that dividend growth has been important for mean-reversions in the US price-dividend ratio earlier in history (link, link) and in international data (link). The implication is that a high valuation today does not necessarily forecast low future returns. Perhaps the answer lies somewhere in between.
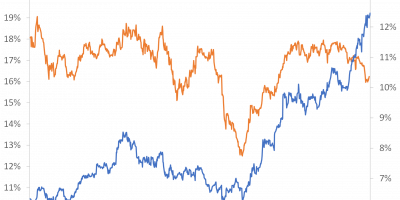
In the US, the dividend yield has declined persistently since the 1950s, as Figure 3 shows.

Data source: http://www.econ.yale.edu/~shiller/
If the price-dividend ratio, and hence the dividend yield, should mean revert without hurting returns, firms should start paying out more dividends. This happened during the 1970s. It might happen again. Or it might not.
Timing
I should emphasize that valuations are good indicators of the eventual effects, but are less useful for market timing. I have said this before, and repeat it here. The implication is that mean-reversion might eventually cause low returns, but whether it happens tomorrow, next year, or in the distant future is difficult to say. It took twenty years of expanding valuations before the stock market eventually imploded in 2001. Many people argued in 1995 that the stock market (at that point in time) looked expensive. It did. It just continued expanding for several years. Then, it eventually crashed. Similarly, valuations have expanded since 2009. It might implode now, or it might not.
The reason I started arguing in autumn that the adjustment might happen (see again here here, and here) is that other things have happened as well. For instance, inflation is very high. The combination of high inflation, monetary policy tightening, and a stock market driven by valuations made the situation fragile, I judged. It seems that this was a fair prediction.
Conclusion
Historically, yields have been the main driver of stock returns. During the past four decades, where interest rates have been falling, dividend yields have also fallen but stock returns have not. Expanding valuations have raised stock returns. The expansion in the price-dividend ratio has been unusually fast since the financial crisis, and even more so during the past three years. If one believes, like me, that permanent bubbles do not exist, valuations will eventually mean-revert.
Mean-reversion in valuations can happen in good ways, through higher growth, or in bad ways, through falling stock prices. There is a possibility, thus, that the endgame will not be horrible. The combination of still high valuations, very high inflation, and a structural reorientation of monetary policy makes one a little nervous, though.