

A few months ago, I argued that there is a real risk stock markets will suffer when central banks tighten monetary policy in response to high rates of inflation (link). This is what we are witnessing now. Stock markets have struggled since the turn of the year in response to monetary policy take-offs and rising rates. To understand why this is happening and where we come from, this blog analyses the performance of the stock market during the past couple of years. Stock returns have been unusually high, given subdued economic growth. How can we comprehend this apparent contradiction and what does it imply for the future?
Stock markets have done very well during the past three years. US stocks (S&P 500) have returned 20% on average per annum in real terms, i.e. after accounting for inflation. At the same time, interest rates have been low. During 2021, where we have also had a lot of inflation, real bond returns have been negative. Compared to a bond investment, the performance of the stock market thus becomes even more impressive. The cumulative real excess US stock return (US real stock returns over and above US real short-term bond returns) has been 82% over the past three years, corresponding to an average annual excess return of 22%.
The last time US stocks had such a great run was during the dot.com bubble in the late 1990s. Before that, we have to go back to the mid-1950s. In fact, during the past 150 years, there have only been ten years when stocks have performed as well. This appears from Figure 1 that shows the average annual real excess US stock returns over three-year periods, from 1874 to 2021, ranked from the highest return to the lowest. The interpretation of the figure is that an excess returns of 22% in 2021 means that the average annual real excess return from the US stock market from 2019 through 2021 was 22%.

Data source: Robert Shiller’s webpage.
Stock returns and economic growth
Perhaps the most striking thing about this 2019-2021 bull market is that stocks have done so well in spite of subdued economic growth.
The pandemic has caused unprecedented contractions in economic activity (link) and (link). We had strong economic growth during 2021, but the large contraction during 2020 implies that economic growth has been weak over the past three years. This appears from Figure 2 that shows for each year during the past 150 years the average annual growth rate of real US GDP over subsequent three-year periods, ranked from the year with the highest three-year growth rate to the year with the lowest. When the figure shows a growth rate of 1.2% in 2021, it means that the average annual growth rate of real GDP from 2019 through 2021 was 1.2%. (Notice: We do not have GDP for the final quarter of 2021 yet, i.e. I use growth from 2020Q3 to 2021Q3 for 2021 growth – I am sure that using 2020Q4 to 2021Q4 growth, when available, will not change the story).

Data source: FRED of St. Louis Fed.
The contrast between Figures 1 and 2 is stark. Figure 1 shows that the stock market has been strong during the past three years while Figure 2 shows that economic growth has been weak. In this sense, it has been three unusually good years in the stock market.
To drive home the point that excess stock returns have been high relative to underlying economic activity, Figure 3 shows how three-year excess returns have correlated historically with three-year growth rates of economic activity.

Data source: Robert Shiller’s webpage.
High stock returns tend to occur during years with high economic growth, as the positively-sloped trend line in Figure 3 indicates. The relationship is not perfect – there is noise – but the overall relation between growth and excess returns is positive.
In Figure 3, I have highlighted the combination of growth and excess returns during 2019-2021. Historically, when excess stock returns have exceeded 20% per annum (on average over a three-year period), economic growth has exceeded at least three percent (annually on average over a three-year period). During 2019-2021, economic activity expanded by 1.2% per year only. The unusual pattern, thus, is that stock returns have been so high relative to economic growth.
Understanding this contrast high stock returns and low economic growth is important if we want to say something about future stock returns.
Earnings and returns
While economic growth has been low, growth in firms’ earnings has been high. Over the past three years, earnings per share (S&P 500 earnings per share) have grown by 18% per year on average in real terms. (Notice: We do not have earnings for the final quarter of 2021 yet, i.e. I use 2021Q3 earnings, like for economic growth above).
Earnings suffered tremendously during the height of the pandemic in 2020, falling by a third year-on-year. Such large earnings contractions have previously only occurred during the Great Depression in the early 1930s, the burst of the dot.com bubble at the turn of the millennium, and the financial crisis of 2008.
On the other hand, earnings performed spectacularly during 2021. In 2021Q3, real earnings were 66% higher than in 2020Q3.
So, we saw earnings fall dramatically during 2020 but rising spectacularly during 2021. On average, over the three years from 2019 to 2021, real earnings have grown by eighteen percent per annum.
Years with high excess returns tend to coincide with years when earnings growth is strong. Figure 4 plots the combination of real growth in earnings per share over a three-year period and real excess returns during the same three-year period, both for the S&P 500. The relationship is positive. Part of the reason why stocks have performed so well during the past three years, thus, is that earnings have been doing well, in spite of the pandemic and everything.

Data source: Robert Shiller’s webpage.
Can earnings explain it all? No. Figure 4 also makes clear that excess returns have been unusually high during this three-year period, given earnings growth. The red dot is situated considerable above the trend line. We conclude that one reason stocks have been doing so well during 2019-2021 is that earnings have been doing well, in spite of the pandemic. But stocks have performed even better than we would have expected, given the earnings growth we have seen.
Why have earnings done so well?
Economic growth and earnings growth are also positively correlated in the data, as Figure 5 shows. When the economy is doing well, firms typically do well. Over the past three years, however, the economy has suffered while earnings growth has been fine (red dot positioned above the trend line). Earnings growth has not been extremely high, given economic growth, but relatively high.

Data source: Robert Shiller’s webpage and FRED of St. Louis Fed.
Why have earnings developed well, when economic activity has been subdued? I do not know the full story, but a number of explanations come to mind.
Funding costs have been low. Yields on corporate bonds have been historically low. Firms have saved some costs here.
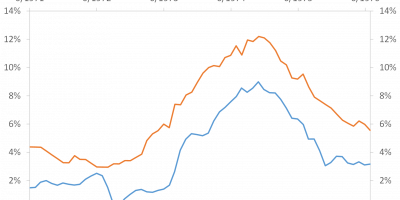
To illustrate, I show in Figure 6 the yield corporations have paid on their loans during the past century – extending back to 1919 – for corporations rated Aaa and Baa by Moody’s. I also show the average yield for Baa-rated firms during the period the Fed has been active in the corporate bond market, i.e. the average yield during the June 2020 through December 2021 period. During this period, corporations have been able to fund their operations at historically low costs, approaching the same low levels as during the 1950s.

Data source: FRED of St. Louis Fed.
There are (at least) two reasons why yields on corporate bonds have been low. The Fed has bought an enormous amount of Treasuries, pushing down the yield on Treasuries. Everything else equal, i.e. given a certain risk premium on corporate bonds, this pushes down yields on corporate bonds. Not everything else has been equal, though. In addition to purchases of Treasuries, the Fed started supporting corporate bond markets in spring 2020, as I explained here (link). Low yields on corporate bonds have helped driving down firms’ funding costs, which in turn supports earnings.
The government has also helped, via furlough schemes and others support measures targeted at corporations. These schemes have sheltered firms from incurring some of the costs they typically incur during a recession. For instance, US GDP dropped by 2.5% following the financial crisis, and earnings dropped by 65%. During this pandemic, GDP fell even more (3.5%), but earnings fell “only” by 33%. Part of the reason for this different sensitivity of earnings to economic activity is probably the different support measures.
Firms have saved other costs during the pandemic. Travelling, for instance, is only a fraction of what it used to be. Firms have upgraded their digitalization during the lockdown, also helping them to save some costs. And there are probably additional reasons. In total, earnings have been high over the past three years, in particular relative to subdued economic growth. This helps explaining the strong performance of the stock market. But stock returns have been even higher than we would normally see given this growth in earnings.
Earnings cannot explain it all
Stock prices have grown faster than earnings. Take for instance the famous Cyclically-Adjusted Price Earnings ratio (CAPE) of Robert Shiller. CAPE takes the real value of the S&P 500 today and divides it by average real earnings per share over the past decade.
In Figure 7, I show two versions of CAPE: Shiller’s CAPE, and a CAPE I call CAPE3y. This divides the real value of the S&P 500 by the average of real earnings over the past three years. CAPE3y thus relates current stock prices to more recent earnings than the original CAPE of Shiller does. I also include the long-run averages of both CAPE and CAPE3y in Figure 7.

Data source: Robert Shiller’s webpage.
Figure 7 shows how the S&P 500 has grown much faster than earnings per share since the financial crisis of 2008 (and during 1980-2001), but also that the rise in CAPE and CAPE3y has been particular strong during the recent three years. Right now, CAPE is at 37, which is the second-highest level ever. CAPE3y is at 32, on par with its value in 2000 and 2003. Also, CAPE trades at a 123% percent premium to its historical average, while CAPE3y trades at a 105% premium. During the past three years, CAPE3y has increased by almost 50%, from 26 in the beginning of 2019 to, as mentioned, 32 today. In total, while CAPE3y does not indicate as “expensive” a stock market as CAPE does (because earnings growth has been strong during recent years), it is still so that stock prices have risen faster than earnings. Earnings explain part of the story, but they cannot explain it all.
There Is No Alternative (TINA)
As the last part of the explanation for stocks’ bull-run, I will point to TINA. TINA is the by-now famous acronym for “There Is No Alternative”. Extremely expansionary monetary policy during the pandemic has driven down yields on safe investments. Monetary policy has also injected a lot of liquidity into the financial system. As a result, there is reason to believe that investors have taken on more risk than they otherwise (without expansionary monetary policy) would have, pushing up prices of risky assets and causing high stock returns as a result.
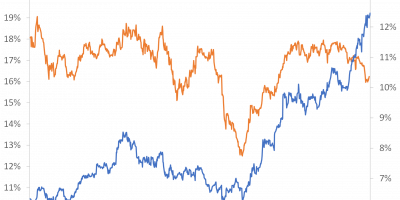
Figure 8 shows how central bank purchases of assets have supported stocks during recent years. The figure shows the combined values of the ECB’s and the Fed’s balance sheets (in billions of USD) as well as the S&P 500. The correlation during the pandemic is striking.

Data source: FRED of St. Louis Fed and Thomson Datastream via Refinitiv.
Low yields, resulting from central bank asset purchases, lower the discount rate used to find the present value of firms’ future cash-flows, thereby increasing stock prices. Low yields also cause investors to shift from low-yielding assets, such as bonds, to stocks, further contributing to rising stock markets. Expansionary monetary policies have supported stocks.
What does the future hold?
I have argued that stock returns have been unusually high during the past couple of years in light of weak economic growth. I have also argued that we can find some explanation in the fact that earnings growth has been strong. Finally, I have argued that earnings cannot explain it all. Stocks currently trade at a high premium relative to historical earnings, and monetary policy has been an important driver of these trends.
Interest will start rising this year. In light of overvalued stock markets, and very high inflation, this is needed and necessary. I have argued for some time that monetary policy should be tightened, but better late than sorry. I thus welcome this development, even when it should have happened earlier.
When central banks tighten monetary policy, and market rates increase as a response, there will be an alternative to stocks. Money that went into stocks because of a lack of a better alternative will revert to bonds. Stocks will face headwinds.
It does not need to end badly, though. Strong growth in earnings could support stocks. However, earnings have been increasing at a fast pace relative to underlying economic growth during recent years, as I have explained, and the question arises whether this can continue. What is needed, thus, is probably some good old-fashioned economic growth that can support earnings and thereby stocks. Most likely, economic growth will be reasonably high this year, supporting stocks. In total, the economic background might provide some comfort for stocks, but it will be a tough fight against high inflation, high valuations, and tight monetary policy.
Expected returns
Can we be more precise about what to expect? We can try. We can for instance consult the Council for Return Expectations (link) and ask what they say.
In the Council, we provide estimates of the expected returns on the global portfolio, MSCI AC, i.e. what follows in this section is not for the US stock markets, as above, but a general view on global markets.
In the Council, we expect global equity to return 5.7% per annum over the next decade, with a standard deviation of 13.3%. I view the 5.7% as a reasonable estimate of the expected return in a normal year. So, if you expect 2022 to be a normal year, 5%-6% return is a good forecast.
On the other hand, I view the tails of the distribution as reasonable guesses if markets turn sour.
Our forecasts imply that there is a 16% probability that returns will be fall below -7.6% in any given year over the next ten years, a 5% probability that they will fall below -16%, and a 2.5% probability that returns will fall below -20% in any random year over the next ten years. Another way of saying this is that we should expect returns to fall below -7.6% in one out of six years, below -16% in one out of twenty years, and below -20% in one out of forty years.
It is a difficult message. Some people have a bad habit of focusing only on our expected 5.7% annual return. They forget there is risk. Our forecasts imply that, occasionally, we should see even large drops in stock markets. There is no contradiction between saying that the expected annual return is 5.7% and markets will drop from time to time.
Our expectations in the Council are for nominal returns. The last time we had a significant drop in the stock market was in 2008, when the S&P 500 returned -35%. This is now almost 15 years ago. It has been a long period without a major setback.
Unconditional probabilities do not predict anything. Our return forecasts imply that one in every twenty years, we should see an annual return below -16%. It is almost fifteen years ago we have had that. Whether we are confronting such an event depends on developments in yields, economic growth, and earnings, as I have described above.
Conclusion
Stock markets have been performing well during the past three years. The return on US stocks over and above the risk-free return has been 22% per year on average. This is one of the highest three-year excess returns in history.
The strong performance of the stock market is remarkable in light of subdued growth in economic activity. Normally, economic growth and stock market returns are positively related, but the past three years have been outliers in the sense that stock returns have been unusually high given low growth in economic activity.
On the other hand, growth in firms’ earnings has been high over the past three years. This helps understanding why returns have been high, but even in light of this earnings growth, stock returns have been unusually high. It seems that investors have driven stock-market valuations to historically heights due to a lack of good alternatives.
Going forward, this might play out nicely, with a smooth increase in monetary policy rates supporting stable economic growth that in turn supports stocks.
There is an alternative, though, where stocks suffer in light of high inflation, high valuations, and increasing interest rates. I have previously argued that this risk is real (link). Whether the turmoil we have seen during the past month indicates something worse to come is difficult to say, but recent events are at least in line with what I expected.
———————————————————————————————-
PS.
I do not know if you noticed, but my last post (link) was taken up by John Cochrane (link), Reuters (link), the Financial Times (link), and many Danish newspapers. Thanks to all for sharing the message that the ECB is facing a dilemma. I will of course follow up on this.