
It’s this time of the year. This post recalls events of 2020. It has been such an unusual year, so different from what we expected. Luckily, there seems to be light at the end of the very long and dark tunnel, and – I hope – that 2021 will be considerably more joyful than 2020.
2020 started out so well. The roaring twenties and all that. Wuhan was a city I had not heard of, corona a beer people tell me is best served ice-cold with a slice of lime (I do not drink beer, tough I do enjoy wine), and social distancing words we would only get to know too well. Today, we know that Wuhan is a Chinese city with more than eleven million inhabitants and a marketplace where it presumably all started, corona also means something terrible, and social interaction is an activity we have come to miss so dearly.
At the time of writing, app. 75 million cases of corona/COVID-19/SARS-CoV-2 have been confirmed globally and app. 1.7 million people have passed away because of corona. Most countries have been in lockdowns, many still are (again), and the social and economic costs of the crisis have been enormous.
I started this blog in April 2020. This had nothing to do with corona. I had wanted to set up a blog for some years (people ask me where I find time for this, and I really do not know, but seemingly I simply like writing economic stories and analyses). Starting the blog in April this year, however, naturally implied that many of the blog posts have dealt with various economic and financial aspects of the pandemic. In this post, I will review some of the learnings from 2020.
The worst recession on record. With the highest growth rate on record
The recession started in February 2020 in, e.g., the US. Initially, it was caused by a supply shock: lockdowns were imposed and firms could not sell their goods and services and households could not go shopping. In April, when the IMF released their Spring Outlook, they labelled it “The Great Lockdown”. This was a suitable label. The IMF also noted that “This is a crisis like no other” and that “many countries now face multiple crises—a health crisis, a financial crisis, and a collapse in commodity prices, which interact in complex ways”. As unemployment and bankruptcies increased, households and firm got nervous, and demand suffered, too.
The path of economic activity has been highly unusual. This graph shows the quarterly percentage changes in US real GDP since 1947:

Source: Fed St. Louis Database
2020 is very much an outlier. On average, from 1947 through 2020, real GDP has grown by 0.8% per quarter. Until 2020, quarterly growth had never exceeded 4%. Economic activity had never contracted by more than 2.6%. Then came the Great Lockdown. During the second quarter of this year, economic activity contracted by 9%. This is almost four times more than the otherwise worst contraction on record. In this sense, it was the worst recession ever.
It has also been the weirdest recession ever. During this recession, we have also witnessed the highest growth rate on record: economic activity expanded by 7.4% during Q3. This is twice as much as the otherwise highest growth rate on record.
This puzzling feature of the recession led me wondering what a recession really is (link). I expressed sympathy with members of the NBER Recession Dating Committee. They face a particularly difficult task this year. Should they conclude that we had one V in spring, with the recession ending in late April, and then a new V now, i.e. two separate Vs (VV), or that we have had one long recession with a double dip, i.e. a double-V (W)? Does it make sense to call it a recession when we experienced the fastest rate of growth in economic activity on record? If you conclude that the economy cannot be in recession when it expands at its fastest growth rate ever, then you must conclude that the recession ended during Q2. But, the NBER Recession Dating Committee has not called the end of the recession yet, i.e., officially, the recession is still ongoing.
You may ask why it is important to know whether the recession ended in April or whether it is still ongoing. The development in economic activity is what it is, whether we call it recession or not. It is important because a “recession” is such an important concept in economics. We inform the public, business leaders, students, and others about the characteristics and consequences of recessions. If a recession can contain the by-far strongest expansion of economic activity on record, we need to change our understanding of recessions.
The very unusual behavior of economic activity during Q2 and Q3 caused very unusual, and scary, developments in unemployment and related aspects of economic activity. This graph shows the monthly change in the number of unemployed in the US:

Source: Fed St. Louis Database
During March, unemployment in the US increased by 16 million. Again, this was beyond comparison. Until March 2020, the number of unemployed had never increased by more than one million over one month. In March 2020, it increased by 16 million.
As the virus contracted during summer, unemployment fell. There has never been as fast a reduction in the number of unemployed as the one occurring during this summer. In May, the number of unemployed dropped by more than three million. Until May 2020, the number of unemployed had never fallen by more than one million over one month. In May 2020, it fell by more than 3 million. So, within a year, we have had the strongest-ever increase in unemployment, but also the largest-ever fall in unemployment. By far.
Such dramatic events happened all around the world. I documented this here (link) and here (link).
Inspired by these events, I did something admittedly nerdy. I calculated the probability that we would experience events such as these, given the historical data (link). I found the unconditional likelihood that we could see the increase in newly registered unemployed that we saw in spring to be 0.97 x 10^(-841). This is a zero followed by 841 zeroes and then 97. For all practical purposes, this is a zero-probability event. But it did happen. It was just very, very unusual.
The stock market
I use some of my time (a significant part, by the way) to try to understand the stock market. This has not been a straightforward task this year.
Today, the global stock market is 13% percent above its January 1 value, the US stock market is 18% higher, and the Danish stock market 29% higher (MSCI country indices). Given that we have been through the worst recession ever, and that the recession is not officially over yet, this is not what one would have expected prior to the events.
Then, on the other hand, in hindsight it is perhaps not so strange. The recession has been the worst on record, yes. But, we have also had the fastest growth in economic activity on record. I argued (link) that if we imagine that the recession ended in late April, when economic activity bottomed out, the behavior of the stock market fits perfectly well with the historical evidence on the behavior of the stock market.
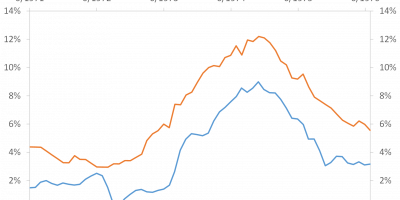
Central banks have certainly played their role, too. When markets melted down in March, central banks intervened heavily. In contrast to the financial crisis of 2008, it was not banks that were in trouble this time, but firms. Firms could not sell their goods and services due to the lockdown. The limitless purchases of government bonds that central banks have become used to during and after crises thus probably did not do much good (evidence came out that central bank purchases of government bonds are less effective than we are often told, link ). What turned things around, instead, was the announcement on March 23 that the Fed would facilitate credit to firms (link). This was a new policy tool. It led to a complete turnaround of events. I produced this graph (I still think it is a supercool graph):

Source: Fed St. Louis Database
The graph shows how the stock market lined up with credit spreads. Firms were suffering, and their credit spreads started widening, in late February. The stock market suffered. The Fed announced it would provide credit to firms on March 23. Credit spreads tightened. The stock market cheered. The graph summarizes how the Fed saved credit and equity markets. And, strikingly, the Fed did so by merely announcing they would intervene. Up until today, the Fed has not intervened a lot. In this sense, it was a “Whatever it takes moment of the Fed”.
It should be mentioned that the Fed announced other initiatives on March 23, too, such as the Main Street Lending Program (link) and the Term Asset-Backed Securities Loan Facility (link). The Corporate Credit Facilities were the ones that directly targeted corporate bonds, though. Due to the nature of this crisis, the stock market lined up with credit spreads during this crisis, as the above graph reveals, emphasizing the importance of the announcement of the Corporate Credit Facilities.
Eurozone troubles, or rather no Eurozone troubles
The fact that we have not had to talk a lot about the risk of a Eurozone breakup since summer has been a positive surprise. In spring, there was talk about the risk of a Eurozone crisis. Like so often before, Italian sovereign yields rose relative to German sovereign yields. There was reason to be anxious. I argued that “Some kind of political solution at the EU level would be needed” (link).
This we got. The European Union agreed on a “Recovery and Resilience Facility” (link) that includes both loans and grants. EU has moved one inch closer towards a common fiscal policy. Who will pay is not clear, but EU has shown solidarity. I believe this is positive. At the same time, the European Central Bank continued its interventions and bought a lot of Italian debt. This has kept yields on sovereign bonds low. Here is the Italian-German yield spread during 2020:

Data source: Thomson Reuter Datastream via Eikon.
Italian yields have been falling continuously since summer, when the EU agreed on its recovery plan. It is positive that we have not had to discuss Eurozone troubles. We have had so many other troubles. Whether this means that we do not have to discuss Eurozone troubles again at some point, I am less sure. But, that is for another day.
Banks have been doing OK
The risk of a Eurozone breakup did not materialize. Another risk that did not materialize was the risk of systemic bank failures. This is positive as well, as economic activity suffers so much more when banks run into trouble and credit consequently does not flow to its productive uses.
During the worst days in March, stress in the banking system intensified. For instance, the spread on unsecure interbank lending increased relative to secure lending:

Data source: Fed St. Louis Database.
Stresses lasted only a few days, though. During the financial crisis in 2008, on the other hand, spreads remained elevated for much longer. This time, trust in the banking system was quickly reestablished.
I think I am allowed to claim that this was one of the predictions I got reasonably right. In autumn 2019, when nobody knew about the upcoming crisis, I wrote a policy paper on the Nordic financial sector. It was presented in December 2019 and finally published in June this year (link). I argued that banks are safer today, compared to 2008. Some doubted my conclusion and said, “just wait until the next crisis, then you will see that banks are not safer today”. Well, few months later we had the worst recession ever. Luckily, though, we have not had bank-rescue packages and we have not had to bail out banks. Banks have been withering the storm. In some instances, banks have even been part of the solution by showing flexibility towards troubled firms. I am not saying everything is perfect, but I am saying that the situation has been very different from the situation in 2008. On a personal note, this made me happy, too, as it would have been somewhat embarrassing if banks had failed at the same time I published an analysis arguing that the banking sector is safer. This, luckily, did not happen. Instead, the banking system turned out to be far more resilient than in 2008, as I predicted.
You may add that the Fed rescued markets during spring, as mentioned above, and thereby rescued firms and subsequently banks. True, but there was certainly also tons of rescue packages in autumn 2008. Banks nevertheless failed in large numbers in 2008. They did not this time around. Perhaps, thus, we did learn something from the financial crisis of 2008, and have gotten some things right. This would be no small achievement.
US election and Brexit
There have been other events, for instance the US election and Brexit negotiations. In normal years, such events would potentially have been among the most important events for markets and the economy. This year, the pandemic has certainly been more important. I did manage to write a post on the US election and the stock market, though (link). I discussed evidence that stock markets perform better under Democratic presidents. Only time will tell whether the same will happen under Biden.
I did not manage to find space to discuss Brexit, but we got a trade agreement on Dec. 24 (link). Hopefully, the EU and UK can now move on.
The cost of the crisis
It is impossible to summarize the pandemic in one number or one word. Hence, I will not attempt to do so. But, I did present a calculation of the expected cost of the crisis in Denmark (link). I arrived at DKK 336bn, or app. USD 10,000 per Dane. This calculation generated some attention in Denmark.
One can discuss every single assumption one needs to make when calculating the expected cost of a crisis: What is the value of a statistical life? What is the value of a statistical life of those who pass away due to COVID-19, i.e. who are typically above 80? What is the past loss as well as the expected future loss in economic activity due to the crisis? Does it make sense to present one number when there is so much uncertainty? And so on. These are all fair points, but if we want to have a meaningful discussion of the impact of the crisis, we have to start somewhere.
In my calculation, I closely followed the assumptions of Cutler & Summers, such that US numbers and Danish numbers can be compared. This allowed me, for instance, to conclude that the cost of the crisis in Denmark, most likely, will be much lower than the cost of the crisis in the US.
Conclusion
I must admit I find it difficult to end this last post of 2020 on a happy note. Right now, at the time of writing, the situation is bad in the country I live, Denmark, and in many other countries in Europe and around the world. Numbers of new cases and deaths have been rising recently, or are on the rise again, and more and more restrictions and lockdowns are being imposed. Days are grey and short. The crisis has already been tremendously costly and it is clearly not over yet.
Nevertheless, I will try to end the post on a positive note. It gives me hope that several countries have started vaccinating people, and it seems to be working well. Finally, the EU also starts vaccinating people now. This has taken way too long, however, given the severity of the crisis and the fact that other countries started weeks ago. And, yes, every day counts. If it is correct, though, and I deliberately write if, that the EU has failed when it comes to the approval process and purchase of vaccines, as the normally well-informed and serious magazine Der Spiegel claims (link), it is a scandal. Biden aims to vaccinate 100m Americans within his first 100 days in office (link), close to a third of the US population. As things look now, it seems unlikely that we will be able to achieve the same in Europe. Christmas is all around us, though, so let us hope that somehow things will develop in the right direction.
Therefore, let me focus on the bright side. With the jabs, the situation will most likely start to improve within a not too distant future. I will try to convince myself that I see weak light at the end of the long and dark tunnel, even when we probably have to wait many months before things really calm down. Days are at least getting longer. I will focus on this, then.
With this, which is meant to be a positive message, let me thank you all for reading this blog and for sending me many encouraging mails with feedback. Please keep on doing so – it is highly appreciated.
I conclude by expressing hope that next year will be considerably more joyful than the one we leave behind.
Happy New Year!